
Figure 4.
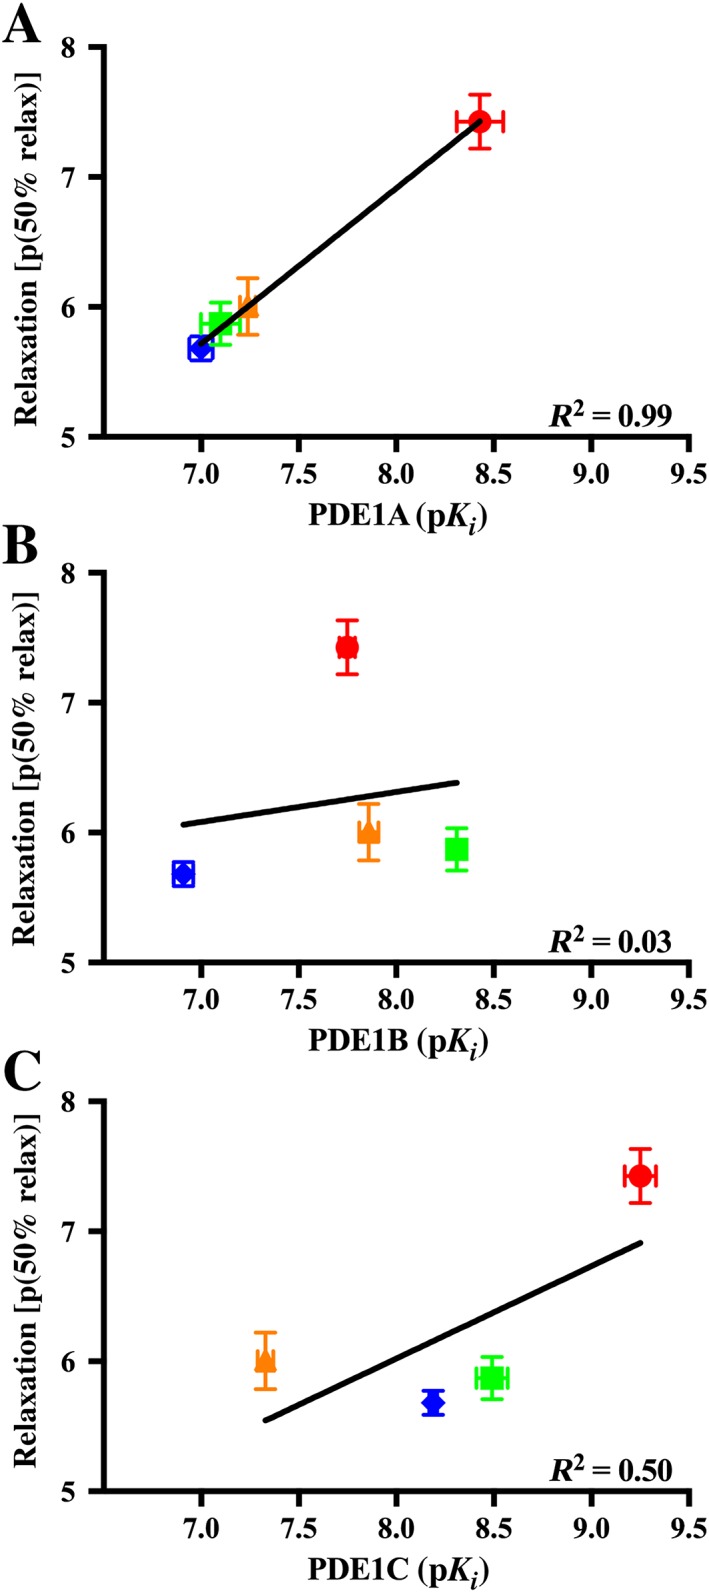
Inhibitory potency for PDE1 isoforms correlated with 50% relaxation potency. Relaxation p(50% relax) values from arteries contracted with U46619 from Table 2 plotted against the pK i values for the PDE1A (A), PDE1B (B) and PDE1C (C) isoforms from Table 1 for the four PDE1 inhibitors. Based on the pK i values for the PDE1A, PDE1B and PDE1C and p(50% relax) values for the four compounds, a linear regression was fitted, and the R 2 value for this linear regression is displayed in the bottom right corner of each graph. Relaxation p(50% relax) values were expressed as the concentration (−Log) of the PDE1 inhibitors giving a 50% relaxation of pre‐contraction with U46619. Data are mean ± SEM. n = 3–9.