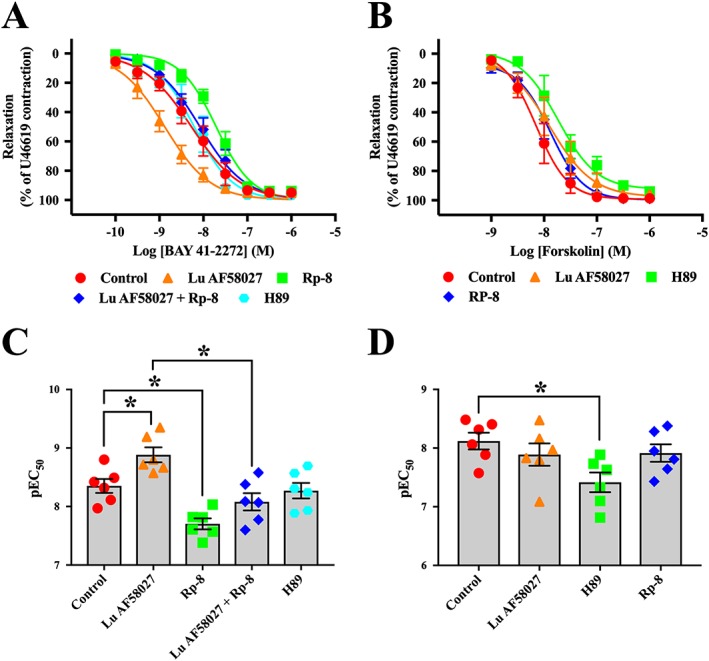
Figure 6.

PDE1 inhibition potentiates sGC activator‐induced relaxation, but not AC activator‐induced relaxation. Cumulative concentration–response curves for the sGC activator, BAY 41‐2272, in the presence of the PDE1 inhibitor, Lu AF58027 (10 nM), and/or the PKG inhibitor, Rp‐8 (10 μM) (A). Cumulative concentration–response curves for the AC activator, forskolin, in the presence of the PDE1 inhibitor, Lu AF58027 (10 nM), or the PKA inhibitor, H89 (1 μM) (B). (C) and (D) show pEC50 values for BAY 41‐2272 and forskolin for the different treatments in (A) and (B) respectively. Mesenteric arteries were contracted with U46619 to approximately 80% of maximal contraction. Data are mean ± SEM. n = 6 arteries from separate rats. Student's t‐test with Bonferroni's multiple comparisons test. *P < 0.05, comparisons are indicated by lines.
