
Figure 6.
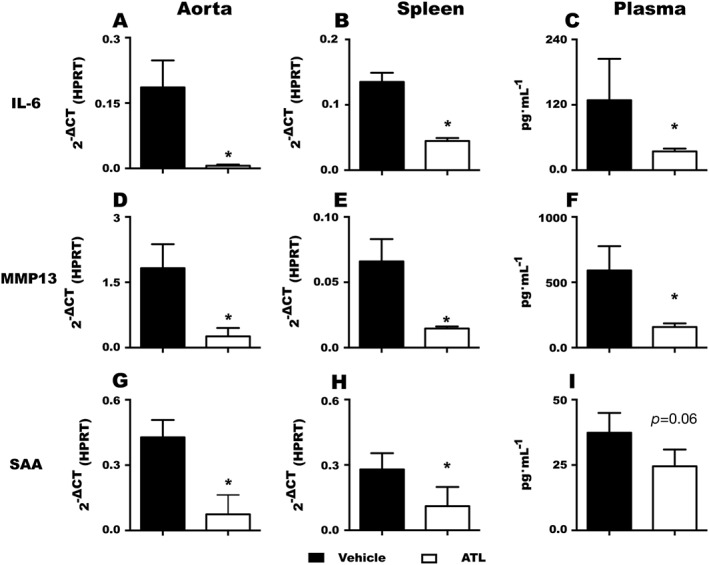
Effects of ATL treatment on IL‐6 (A–C) and MMP13 (D–F) and serum amyloid A (SAA; G‐I) mRNA levels in the aorta (A, D and G), and spleen (B, E and H) and protein levels in plasma (C, F and I). Data (mean ± SEM) are expressed as either 2‐ΔCT or pg·mL−1 for n = at least 6 in each group. *P < 0.05.