Figure 1.
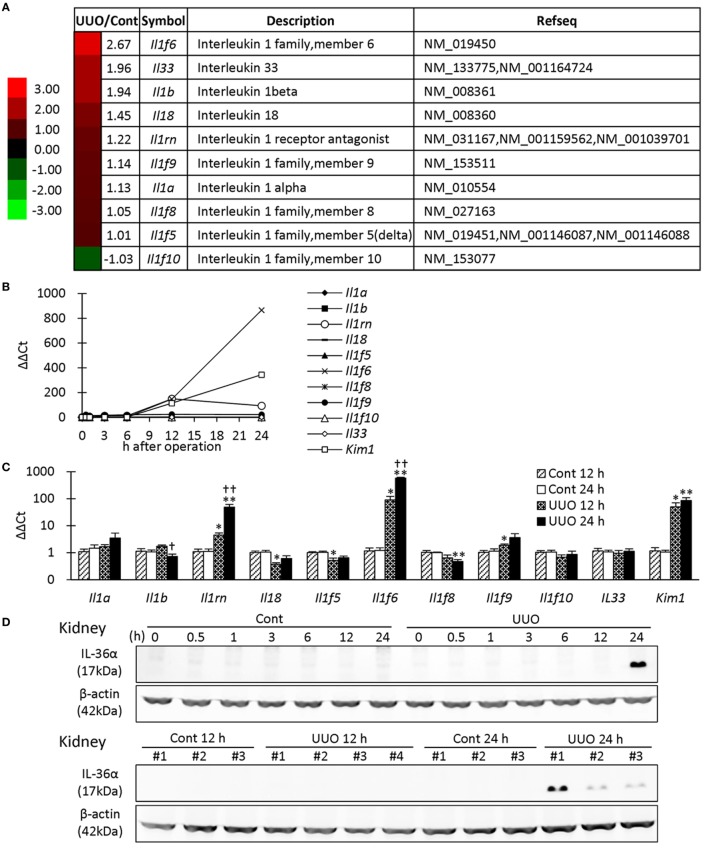
Expression of IL-1 family members in unilateral ureter obstruction (UUO) kidneys. (A) Gene expression of IL-1 family members analyzed by microarray at day 7 after UUO. The values indicate the fold increase of UUO kidney to Cont kidney. Heatmap scale bars indicate the relative changes. (B) Time course of mRNA expression of IL-1 family members and Kim-1 in UUO kidneys (n = 1). (C) Relative mRNA expression of IL-1 family members and Kim-1 in Cont and UUO kidneys. Values = mean ± SE. A significant difference from the Cont is indicated by *(P < 0.05) or **(P < 0.01). A significant difference from 12 h in the same group is indicated by †(P < 0.05) or ††(P < 0.01). q ≥ 4 kidneys. (D) Immunoblotting analysis of IL-36α and β-actin expression in Cont and UUO kidneys.

