Figure 4.
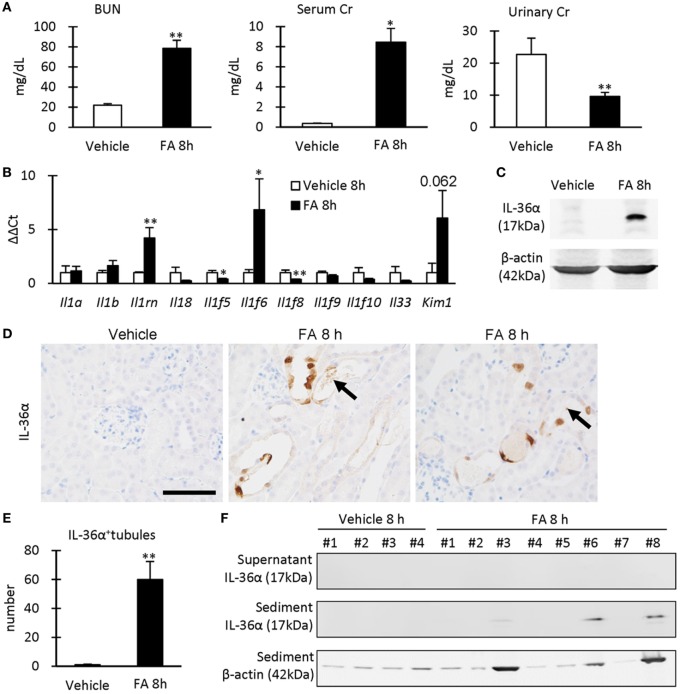
IL-36α expression and renal dysfunction in folic acid (FA)-induced AKI mice. (A) Serum levels of blood urea nitrogen and creatinine (Cr) and urinary level of Cr in vehicle control and FA groups after 8 h of FA injection. Values = mean ± SE. A significant difference from the vehicle control is indicated by *(P < 0.05) or **(P < 0.01) (n = 5–8). (B) Relative mRNA expression of IL-1 family members and Kim-1 in the kidneys of vehicle control and FA groups at 8 h after FA injection. Values = mean ± SE. A significant difference from the vehicle control is indicated by *(P < 0.05) or **(P < 0.01) (n = 5–8). (C) Immunoblotting analysis of IL-36α and β-actin expression in the kidneys of vehicle control and FA groups at 8 h after FA injection. (D) Immunohistochemistry for IL-36α in the kidneys of vehicle control and FA groups at 8 h after FA injection. IL-36α+ immunostaining is observed in the cytoplasm, and some nuclei are also stained. Arrows show IL-36α+ cell debris. (E) The number of IL-36α+ tubules in the kidneys of vehicle control and FA groups at 8 h after FA injection. Values = mean ± SE. A significant difference from the vehicle control is indicated by **(P < 0.01). n = 5–8. (F) Immunoblotting analysis of IL-36α and β-actin expression in the urinary samples of vehicle control and FA groups at 8 h after FA injection.

