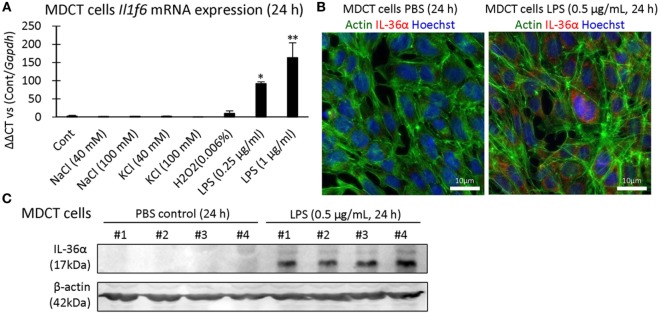
Figure 6.
Induction of IL-36α in vitro. (A) Il1f6 mRNA expression in 209/MDCT cells after stimulation with various agents for 24 h. A significant difference with PBS control (Cont) is indicated by *(P < 0.05) or **(P < 0.01) (n = 4). (B) Immunofluorescence in 209/MDCT cells after PBS or LPS exposure for 24 h. Green, red, and blue indicate pan-actin, IL-36α, and nuclei, respectively. (C) Immunoblotting for IL-36α and β-actin using cell lysates from 209/MDCT cells after PBS or LPS exposure for 24 h.

