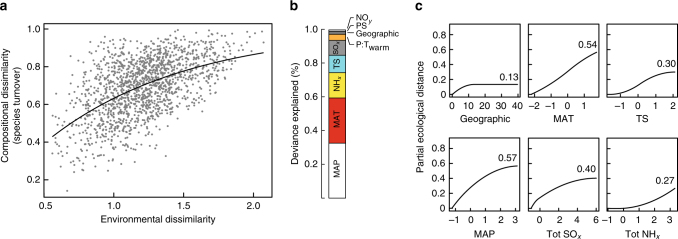
Fig. 2.
Taxonomic turnover along environmental gradients. a Relationship between observed plant community compositional dissimilarity between site pairs (species turnover or β-diversity) and their predicted environmental dissimilarity. The line represents the linear predictor of the regression equation from generalized dissimilarity modelling (GDM, Methods section). b Reduction in deviance explained between full model and model with the environmental variable omitted, i.e., an indicator of the proportion of deviance attributed to that variable. Variables tested were geographical distance, mean annual temperature (MAT), seasonality in temperature (TS), mean annual precipitations (MAP), seasonality in precipitation (PS), ratio of precipitation and temperature of the warmest quarter (P:Twarm), sulphate (SOx), and reduced (NHx) and oxidised (NOx) nitrogen atmospheric depositions. c Partial regression fits (Model-fitted-I-splines) for variables significantly associated with plant community species turnover. Note that we also included geographical distance for reference. The maximum height (inset number) reached by each I-spline curve indicates the relative importance of that variable in explaining beta diversity, keeping all other variables constant (i.e., the partial response curve value). The shape of each function provides an indication of how the rate of compositional turnover varies along the environmental gradient

