Fig. 4.
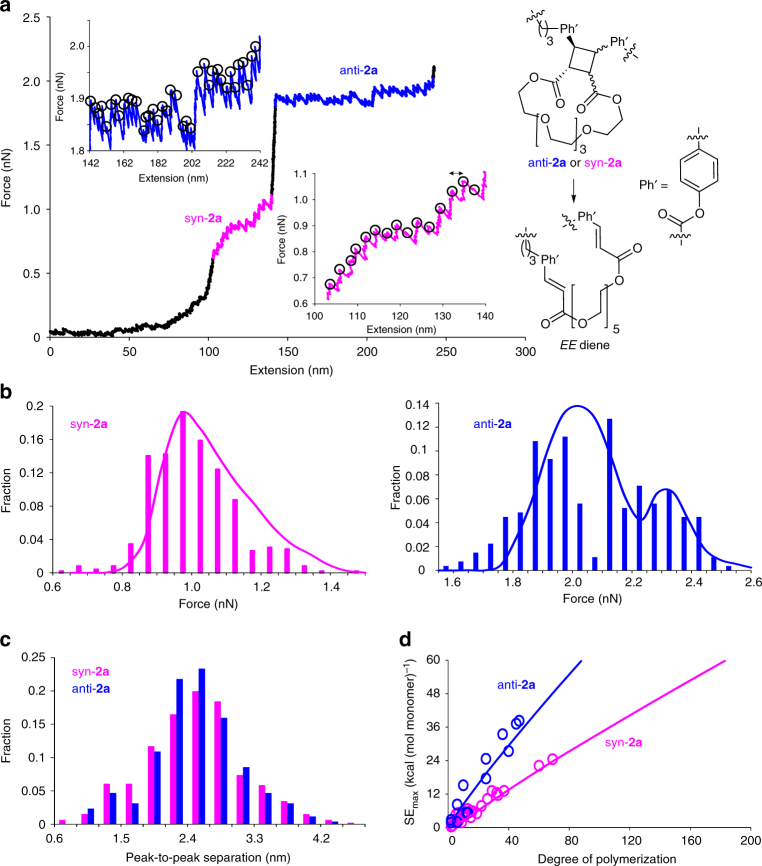
Summary of single-chain mechanochemistry of macrocyclic cinnamate dimers. a A representative force/extension curve of copolymer P2. The two plateaus, resulting from dissociations of syn-2a and anti-2a to E,E diene are highlighted in magenta and blue, respectively. Magnified plateau regions in the insets illustrate the saw-tooth pattern corresponding to dissociation of individual dimers, identified by black circles. b The experimental (bars) and computed (solid lines) distribution of dissociation forces at the 1st (magenta) and the 2nd (blue) plateaus. c The observed distribution of peak-to-peak separations, corresponding to an increase in the polymer contour length upon dissociation of individual dimers. d Calculated (solid lines) and experimentally derived (circles) maximum strain energies that a single macromolecule of syn-2a (magenta) or anti-2a (blue) can sustain before failure

