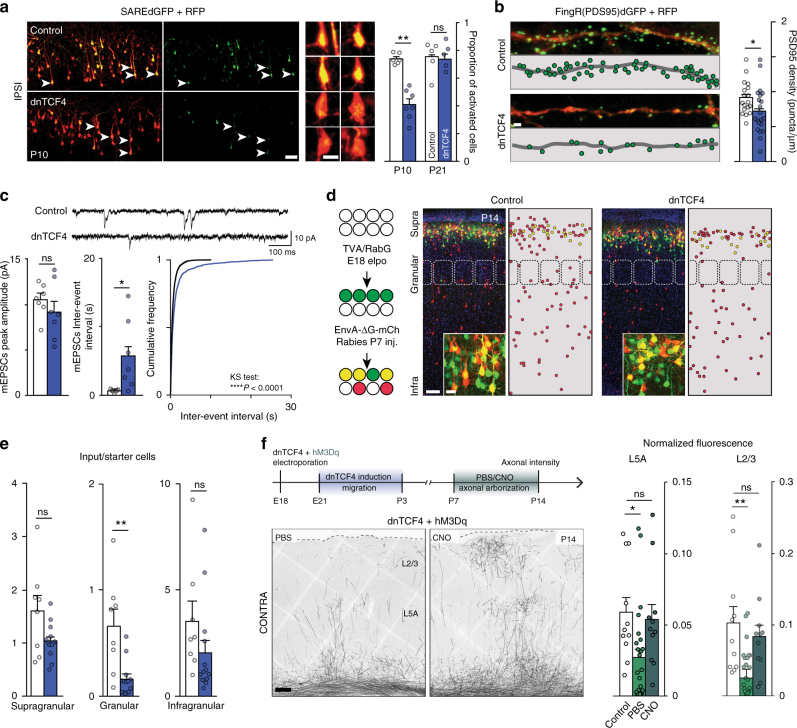
Fig. 5.
Delayed callosal projection neurons display reduced synaptic input and reduced neuronal activity. a Activity-reporter (SAREdGFP) shows decreased GFP expression in late-arrived neurons (arrowheads mark activated cells, magnified at right). Graph shows the proportion of GFP-positive activated cells during axonal arborization (P10) and at P21; n = 6 and 7 brains (Control vs. dnTCF4, respectively) at P10 and n = 5 brains at P21, Mann–Whitney, P > 0.9999 for P21. b Excitatory connections labeled by PSD-95-specific FingR-GFP showing a decreased number of synaptic puncta in neurons with delayed migration (dnTCF4); n = 18 and 21 cells from 3 and 4 brains (Control vs. dnTCF4, respectively), Mann–Whitney. c mEPSCs recording samples of layer 2/3 pyramidal neurons for control (top trace) and dnTCF4 (bottom trace) P14-P15 animals. No significant difference in amplitude and a significant increase in mEPSCs inter-event interval for dnTCF4 animals; n = 7 animals per group, 1 cell per animal, Student’s t test (bar graphs, P > 0.9999 for P21), Kolmogorov–Smirnov test (cumulative distribution). d Rabies-mediated monosynaptic retrograde tracing (schematized at left) shows reduced afferent inputs on late arrived (dnTCF4) starter cells, magnified inserts display equal density of starter cells. e Quantification of input/starter cells shows a major reduction of inputs from the granular layer; n = 8 and 14 brains (Control and dnTCF4, respectively), Mann–Whitney, P = 0.1876 for supragranular layer. f The timeline showing the experimental design used for rescuing aberrant callosal projections via hM3Dq DREADD receptor activation. Daily clozapine-n-oxide (CNO) injections were performed during axonal arborization. Chemogenetic stimulation of late-arrived CPNs rescues contralateral arbors compared to non-activated neurons (PBS injection); n = 11, 24, and 11 brains (Control, PBS, CNO, respectively), Kruskal–Wallis, Control vs. CNO: P = 0.5455 for L5A P > 0.9999 for L2/3. Graphs display mean ± s.e.m. ns, non-significant, *P < 0.05, **P < 0.01. Bars = 5 μm (b), 20 μm (a and d, insert), 50 μm (a, overview) and 100 μm (d and f, overview)

