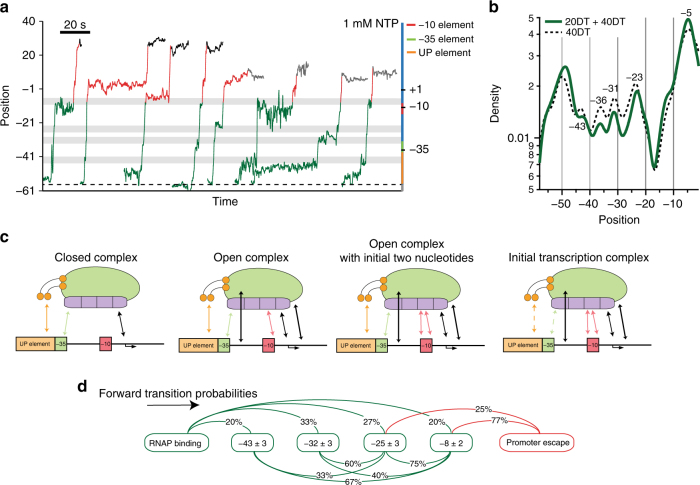
Fig. 4.
Real-time transcription initiation records. a Eight representative records showing RNAP holoenzyme initiation. Left axis: holoenzyme position; measured extensions (in nm) were converted to nucleotide positions relative to the TSS. Right axis: non-template strand promoter sequence, using the color scheme of Fig. 2. The starting base of the hairpin stem is indicated (black dashed line, position −56). The records are color coded with respect to the stages of initiation process: stepwise contact remodeling (green), productive initiation (red), and stalled at the end of the template (40DT template, black; 20DT template, gray). Gray bars indicate the positions of strong contacts. b Semi-log plots of the mean density of records obtained in the presence of NTPs on the 40DT template (N = 12, black dotted curve), and the 40DT and 20DT templates combined (N = 16, green curve). The maxima confirm the assignment of contacts (see text). c Summary of the contacts remodeled within the RNAP-promoter complex during transcription initiation. Solid arrows indicate essential contacts; dashed arrows indicate non-essential contacts (arrows are color coded by their respective elements). d Transition probabilities in the forward direction (black arrow, computed percentages exclude reversible transitions between states) from RNAP binding to promoter escape (N = 44 transitions from 15 molecules, color code same as a). The states (rounded squares) were identified based on dwells lasting >1 s, and named according to their positions on the T7A1 promoter

