
Figure 4.
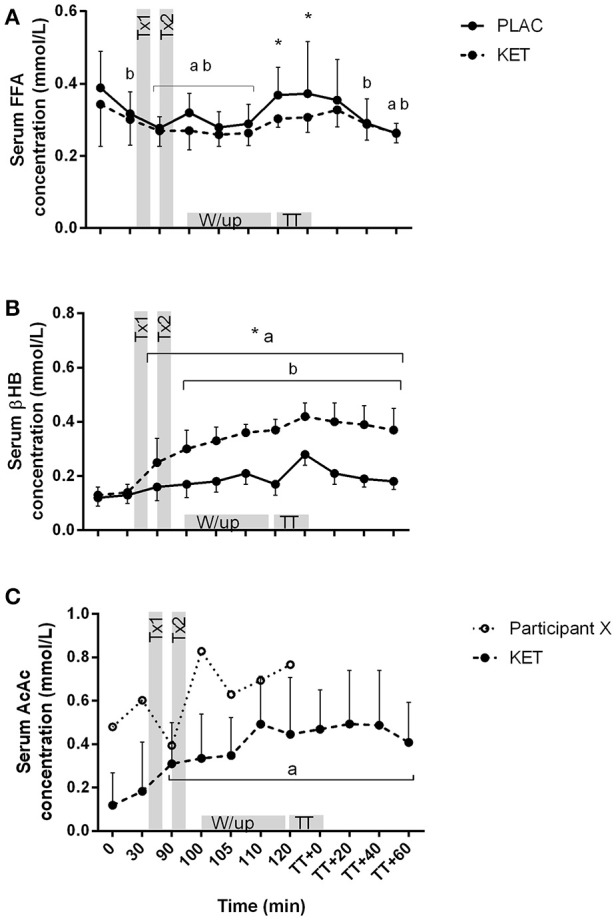
Serum FFA (A), βHB (B), and AcAc (C) concentrations following exogenous KET or PLAC ingestion whilst completing a cycling TT. Values are mean ± SD. Tx1 and Tx2 refer to dose one and two of KET or PLAC drink. *KET different to PLAC at time point; a different to t = 0 min within KET; b different to t = 0 min within PLAC.