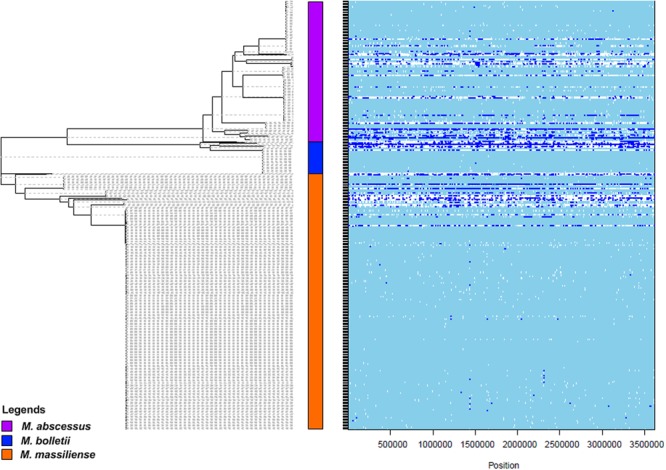
FIGURE 3.

Genome wide recombination plot (obtained with the ClonalFrameML) and supersequence SNP-based phylogenetic tree (generated with PhyML) for the M. abscessus complex. The plot on the right shows the presence of recombination (in blue) and mutation (in white) throughout the genomes of the M. abscessus complex. In the phylogenetic tree, purple = M. abscessus, red = M. bolletii, blue = M. massiliense.
