Figure 3.

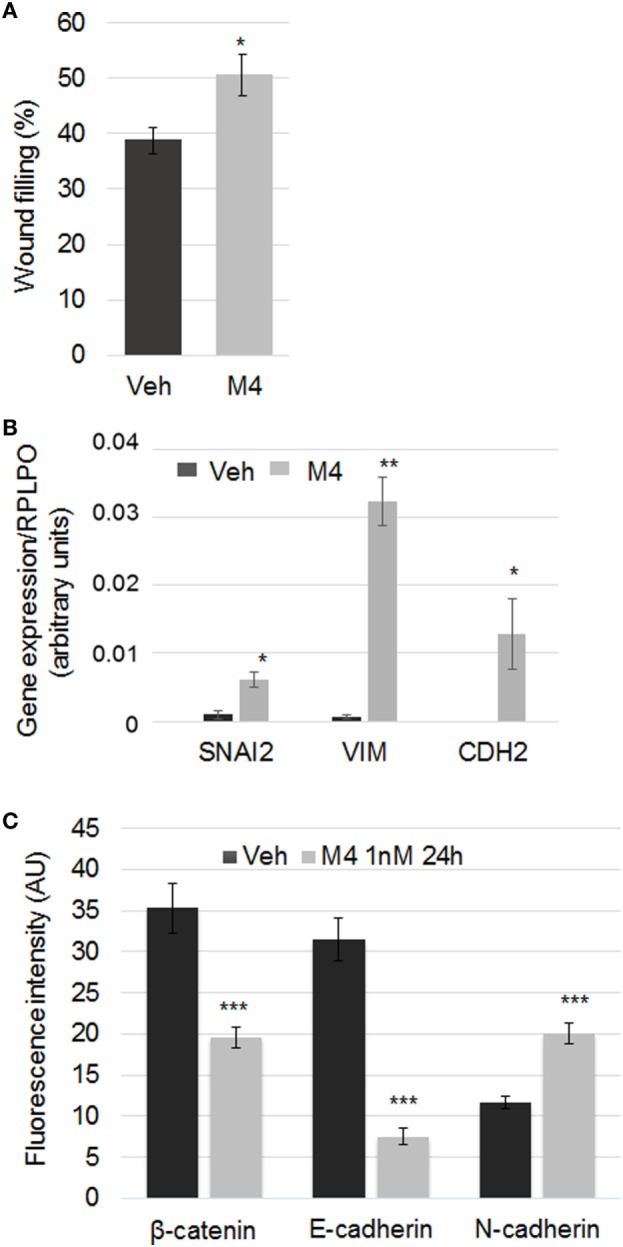
M4 promoting epithelial-mesenchymal transition (EMT). (A) A wound was performed on a confluent monolayer culture of MCF-10A cells. The histogram depicts the wound width when measured after a 6 h treatment. Each bar represents mean ± SD. N = 5. *p < 0.05. (B) MCF-10A cells were treated for 24 h with vehicle or 1 nM M4. Gene expression of EMT markers was measured by RT-PCR analysis. SNAI2, VIM, and CDH2 expression was induced after M4 exposure. The housekeeping gene RPLPO was used as the reference gene. Each bar represents mean ± SD. N = 3. *p < 0.05; **p < 0.01. (C) MCF-10A cells were treated for 24 h with vehicle or 1 nM M4. Quantification of cell–cell adhesion protein expression was performed by immunofluorescence with specific antibody (red, AlexaFluor 555). An “E- to N-cadherin switch” as well as a significant decrease of β-catenin expression was observed in M4-treated MCF-10A cells as compared to control. Average fluorescent signal intensities were quantified from at least five cells per condition in each experiment (see Materials and Methods). Each bar represents mean ± SD. N = 4. ***p < 0.001. RT-PCR, reverse transcription polymerase chain reaction.
