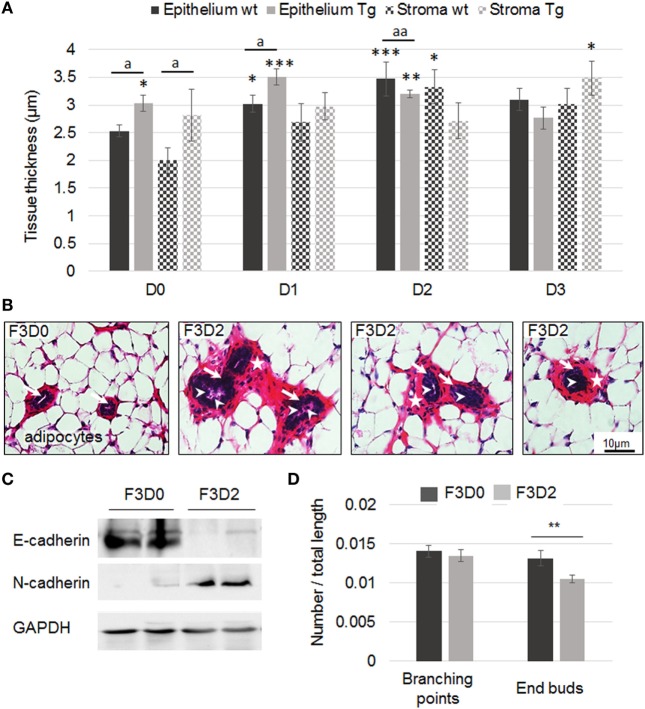
Figure 5.
Mammary gland histology of F3 wild-type or transgenic (Tg) mice exposed to M4. (A) Quantification of epithelium and stroma thickness in F3 mammary gland following exposure to sesame oil (D0) or M4 [0.05 µg (D1), 0.5 µg (D2), or 5 µg M4/kg/day (D3)]. Measurements were performed on PND21. Each bar represents mean ± SEM. Epithelium or stroma thickness was measured on at least five independent slices from each animal included in the experiment. N: number of animals/dose/genotype. D0wt: N = 7; D0Tg: N = 5; D1wt: N = 6; D1Tg: N = 4; D2wt: N = 4; D2Tg: N = 8; D3wt: N = 3; D3Tg: N = 4. *, **, or *** = significantly different from D0 wild-type (wt) mice. a or aa = Tg mice significantly different from wild-type littermates exposed to the same dose (* or a p < 0.05; **; aa p < 0.01; ***p < 0.001). (B) F3 mammary gland exposed to M4 (D2 = 0.5 µg/kg/day). The slices show mammary ducts surrounded by stroma (stars) and adipocytes. Disorganization of the epithelium (arrows) was observed in D2 exposed F3 mammary glands and cellular material (arrowheads) was present into the lumen of some F3D2 female ducts. Scale bar, 10 µm. (C) Representative western blot analyses of E-cadherin, N-cadherin, and GAPDH (loading control) protein expression levels in total mammary gland harvested from F3D0 or F3D2 pups. (D) Mammary trees from F3D0 (N = 4) or F3D2 (N = 9) exposed mice were whole mounted. Computational analysis of the mammary tree total extension, number of branching or end buds was performed using dedicated software. Results are represented as a ratio of number of branching or end buds/mammary tree total length. The number of end buds was significantly reduced in F3D2 pups. Each bar represents mean ± SEM. **p < 0.01. GAPDH, glyceraldehyde-3-phosphate dehydrogenase.

