Fig. 1.
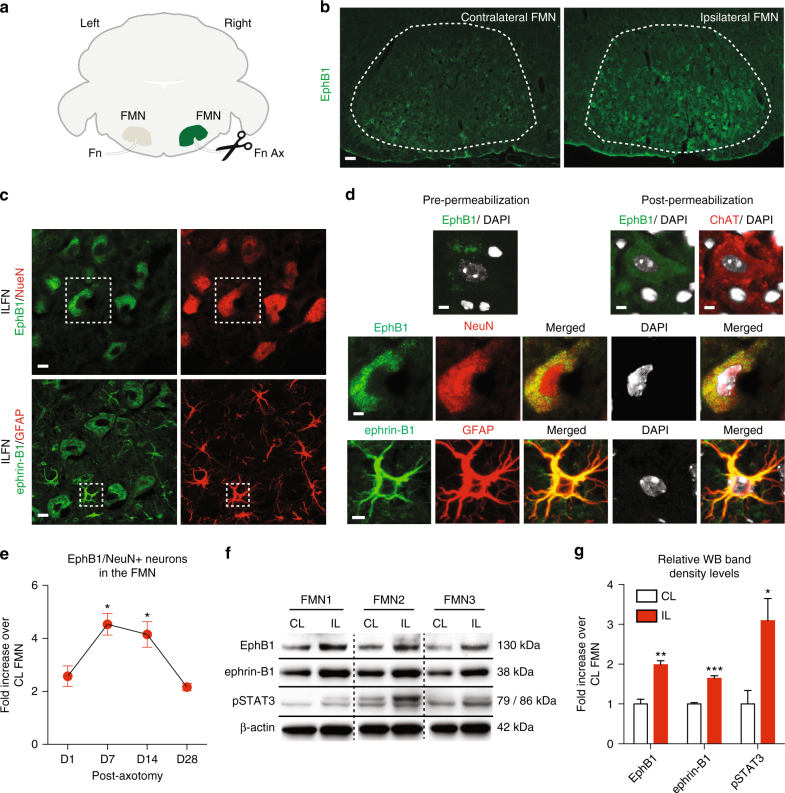
EphB1 is upregulated in axotomised neurons, where astrocytes display ephrin-B1 IR. a Schematic diagram demonstrating right-sided unilateral facial nerve (Fn) axotomy (Ax) and the associated ipsilateral (IL) facial motor nucleus (FMN) in which immunofluorescence was analysed in comparison with the non-axotomised contralateral (CL) FMN. b Representative immunofluorescence images showing abundant EphB1 IR 14 days after axotomy in the IL FMN in which 98% of neurons are defined as motor neurons34. c Images showing EphB1 and NeuN labelling and also ephrin-B1 and GFAP IR in corresponding neurons or astrocytes (ACs), respectively. d High magnification images demonstrate cell surface labelling for EphB1 in sections immunostained before permeabilisation and also cytoplasmic EphB1 IR post-permeabilisation in a ChAT-positive motor neuron (MN) (see also Supplementary Fig. 1) and NeuN positive neurons with motor neuron morphology32 in the middle panel. In the lower panel ephrin-B1 positivity is demonstrated in GFAP-labelled astrocyte soma and processes (see also Supplementary Fig. 1). e Graph showing the mean of fold changes in the proportion of EphB1-positive neurons in the IL FMN normalised to the CL FMN following axotomy (1, 7, 14, 28 days; n = 3 per time point, respectively, and 3–4 brainstem sections in each group; *p = 0.016, *p = 0.046 compared to values at day 1, F = 9.431; one-way ANOVA with Dunnett’s post hoc test; see also Supplementary Fig. 1). f Western blot (WB) showing EphB1, ephrin-B1 and pSTAT3 protein levels (both 79 and 86 kDa isoforms) in tissue lysates from both the IL and CL FMN of three WT mice at day 14 post-axotomy (see also Supplementary Fig. 8). g Bar graph represent relative WB band densities of EphB1, ephrin-B1 and pSTAT3 in the IL FMN and is expressed as fold increase over the band density levels for the CL FMN after normalisation to β-actin (n = 3 mice, unpaired t-test, **p = 0.006, ***p = 0.0004, *p = 0.034). Data presented as mean ± SEM. Scale bars: 50 μm for (b), 20 μm for (c) and 10 μm for (d)

