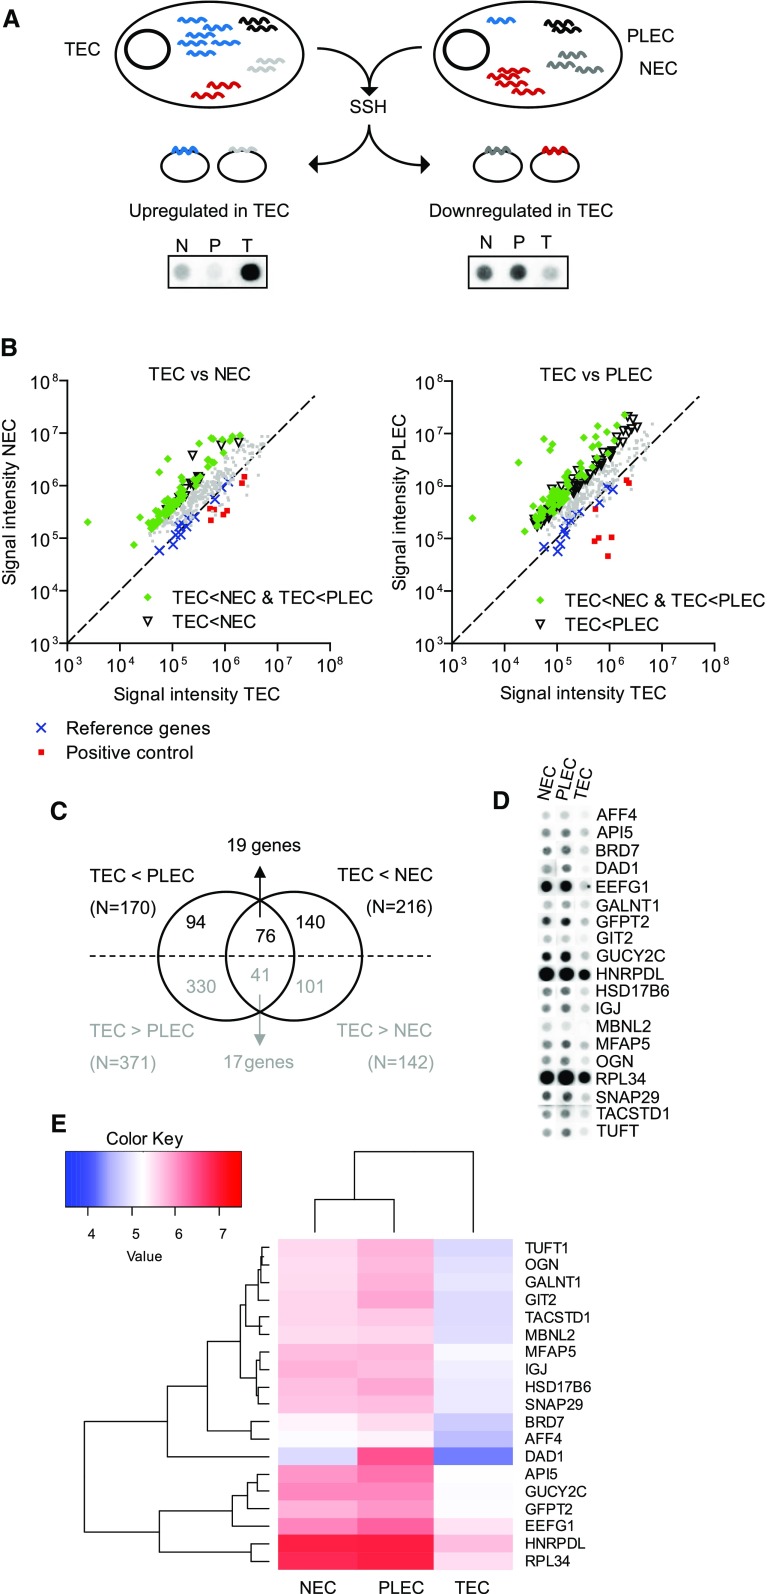
Fig. 1.
Identification of genes downregulated in tumor EC. a Schematic overview of suppression subtractive hybridization (SSH) and differential (cDNA array) screening. Transcripts differing in abundance between tumor EC (TEC) and placenta EC (PLEC) or normal EC (NEC) are cloned in cDNA libraries. b The subtracted and enriched cloned repertoires were arrayed and probed with cDNA from TEC, NEC and PLEC. Shown are spot intensities in comparisons between TEC and NEC (left panel) and between TEC and PLEC (right panel). A clear bias toward genes suppressed in TEC is apparent, confirming successful subtraction. Spots showing > 3.5-fold expression differences in either comparison (triangles) or in both comparisons (green diamonds) are indicated, as are the reference genes (blue crosses) and positive controls (red squares). c, d 170 spots showed > 3.5-fold expression difference in TEC versus NEC and 216 spots showed > 3.5-fold lower expression in TEC versus PLEC. 76 clones showed overlapping profiles (c) and were shown to represent 19 different mRNA transcripts (d). e Heatmap and unsupervised clustering on average Log10 normalized intensities (see Table S1) of the top gene list

