Figure 1.
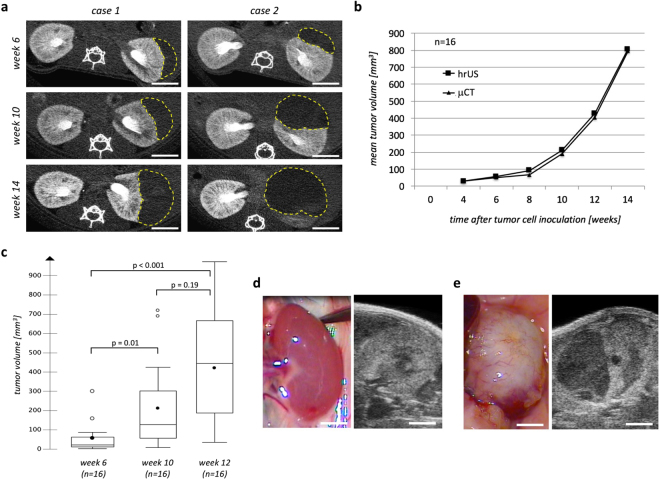
Orthotopic tumor cell engraftment and growth after renal subcapsular implantation of 1 × 10⁶ CAKI-2 cells. (a) Representative cross-sectional CT images from two cases 6, 10 and 14 weeks after tumor cell implantation. Tumors are marked by a dashed yellow line. Scale bar = 3 mm. (b) Mean tumor volumes as detected by high-resolution ultrasonography (squares) and contrast-enhanced micro-CT (triangles) 4, 6, 8, 10, 12 and 14 weeks after orthotopic tumor cell implantation. (c) Box-Whisker plots of tumor volumes 6, 10 and 12 weeks after tumor cell implantation as detected by ultrasonography. Each box represents the range from the first quartile to the third quartile. The median is indicated by a line, the mean by a black circle. Outliers outside the 1.5 fold interquartile range are displayed by white circles. (d) Microphotograph (left) and hrUS-image in transverse orientation (right) of a normal left kidney of a 22 weeks old female Balbc/nude mouse. Scale bar = 3 mm. (e) Microphotograph (left) and hrUS-image in transverse orientation (right) of a tumor-bearing left kidney in a 22 weeks old female Balbc/nude mouse 14 weeks after renal subcapsular implantation of 1 × 10⁶ CAKI-2 cells. Scale bar = 3 mm.

