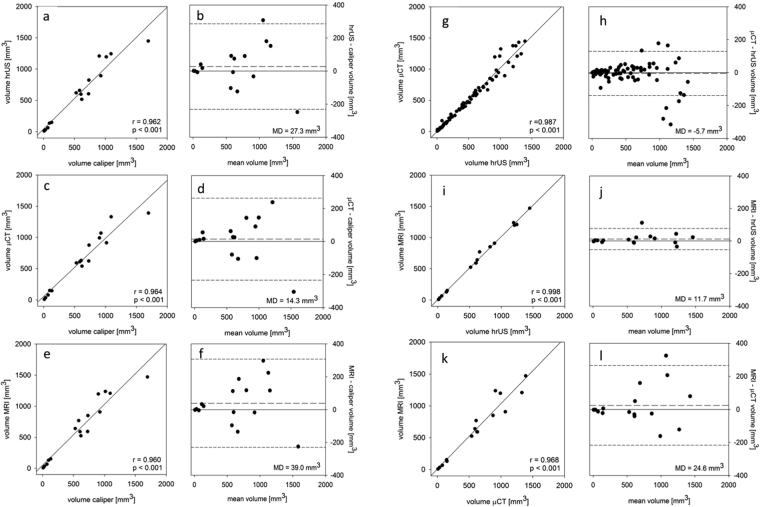
Figure 4.
Primary tumor volumetry. Correlation of primary tumor volumetry by caliper measurement (n = 16), hrUS (n = 96), μCT (n = 96) and 9.4T MRI (n = 16), as assessed by linear correlation analysis (a,c,e,g,i,k) and Bland-Altman analysis (b,d,f,h,j,l). To create a Bland-Altman plot, the mean for primary tumor volumes measured by the two methods to be compared was plotted on the horizontal axis and the differences between the two types of measurement were plotted on the vertical axis. long-dashed line = median deviation (MD), short-dashed line = double standard deviation, r = correlation coefficient.

