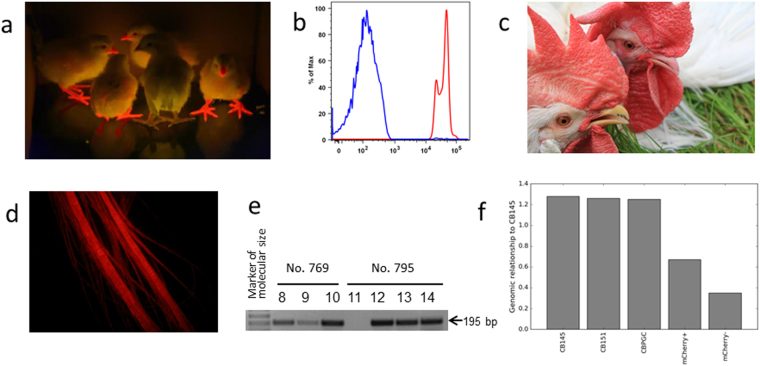
Figure 4.
Phenotypic and genetic analysis of G1 offspring. (a) Freshly hatched G1 offspring, one mCherry-negative chicken in the middle. (b) Distribution of mCherry-positive cells in the peripheral blood. FACS histogram of mCherry signal in red blood cells (blue) and white blood cells (red). (c) mCherry positivity visible in the beak and featherless skin of the mCherry-positive rooster (right) in the daylight. The mCherry-negative wt rooster shown as a control (left). (d) Photostability of mCherry shown as mCherry signal in adult feather. (e) The 195 bp PCR product of the CB-specific tpn allele amplified in DNA of G1 offspring. The results of animals Nos 8 to 14 (from left to right) are shown, the non-CB chicken No. 11 is in the middle. Descendants of G1 roosters Nos 769 and 795 are indicated. (f) Genomic relationship of inbred individual CB145 with itself, inbred individual CB151, the primordial germ cell line, the mCherry+ chicken Robin and a mCherry- chicken. The genomic relationship was calculated based on about 1.6 million maximum quality SNP detected in 78 chickens.

