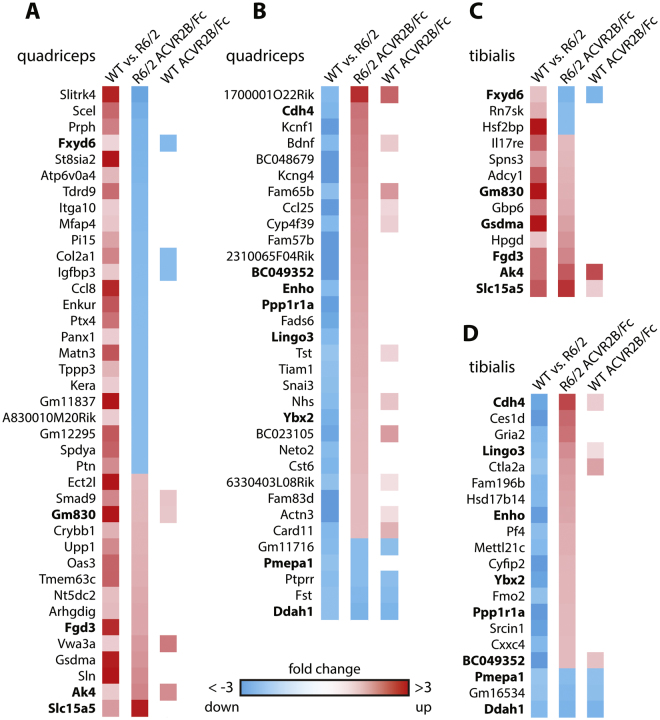
Figure 6.
The effect of ACVR2B/Fc treatment on genes that are dysregulated in R6/2 muscle. The first column in each panel indicates the change in gene expression in R6/2 muscle as compared to WT. Red squares represent an increase and blue squares, a decrease in expression levels. The second column represents the change in gene expression levels in R6/2 muscle in response to ACVR2B/Fc treatment and the third column indicates when a gene in WT muscle was also significantly changed in response to treatment. All of the depicted genes were changed to statistically significant levels (adjusted p < 0.05) with a fold change greater than 1.5. Genes in bold were changed in both quadriceps and tibialis anterior. The panels represent genes that are (A) increased or (B) decreased in the quadriceps and (C) increased or (D) decreased in the tibialis anterior of R6/2 mice as compared to WT. RNAseq was performed on RNA extracted from n = 10 mice/treatment group.

