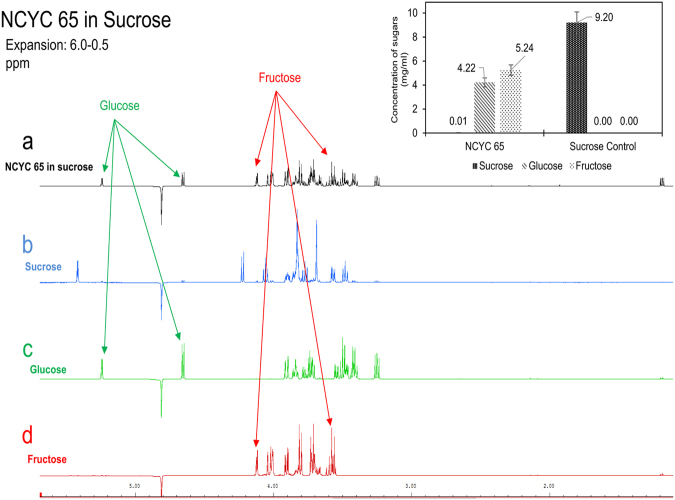
Figure 5.
The NMR spectrum of NCYC 65 in sucrose (a), sucrose standard (b), glucose standard (c) and fructose standard (d). Spectrum (a) contains the same peaks as spectrum (c) and spectrum (d) which means that glucose and fructose are present in spectrum (a). No similarity was identified between spectrum (a) and spectrum (b) which means no sucrose in spectrum (a). The graph on the top right shows the quantification of glucose, fructose and sucrose of sample “NCYC 65 in sucrose” and sample “sucrose control”. This illustrates sucrose was completely degraded into glucose and fructose by yeast strain NCYC 65. Results were collected from triplicates.

