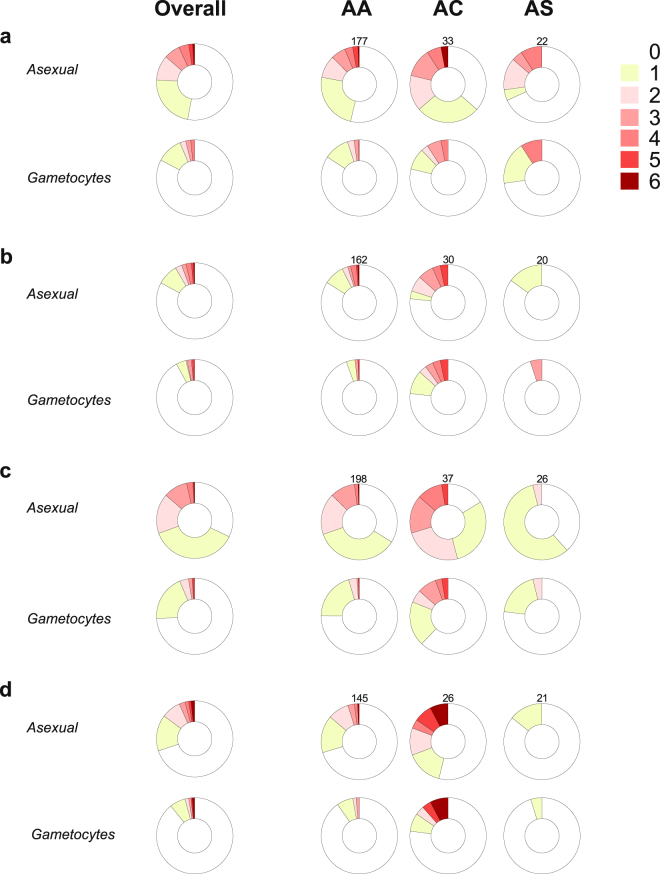
Figure 1.
Longitudinal patterns of malaria infection by hemoglobin type. Distribution of study participants by number of scheduled visits with patent parasites during the wet season of the year 2011 (a), the dry (b) and wet (c) seasons of the year 2012 and the dry season (d) of the year 2013. Only individuals with 4 or more scheduled visits during each period are included. Numbers above donut charts in each panel indicate the sample sizes of genotype groups for that season.

