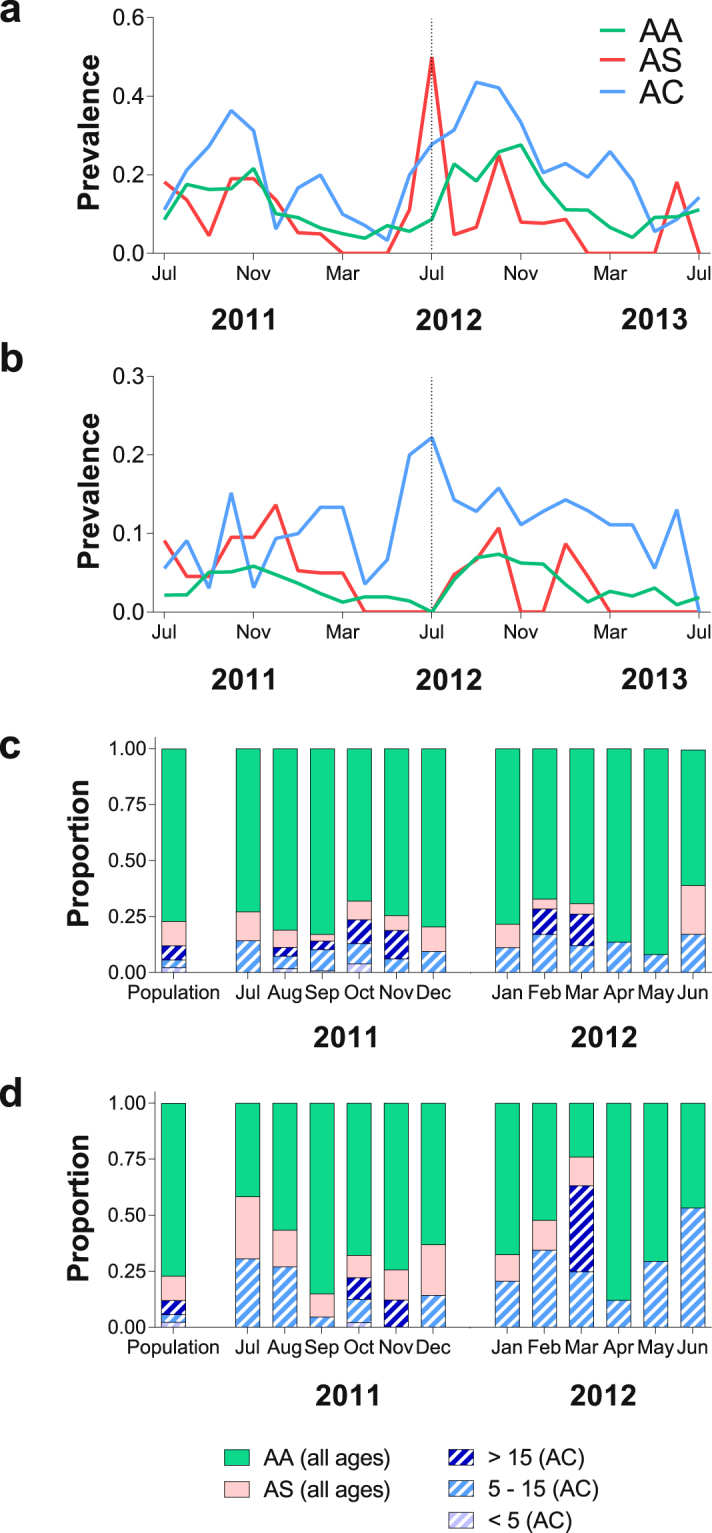
Figure 2.

Contributions to the malaria reservoir. Prevalences of (a) asexual parasites and (b) gametocytes by month and hemoglobin types. The vertical dotted line represents the time-point when 250 additional adults were recruited, and children aged 5 years or less stopped being followed. (c,d) Proportion of parasitemic individuals in the community from different age groups and with different hemoglobin variants ((c) corresponds to infections [asexual or sexual stage parasites]; (d), to patent gametocytes); hatched areas represent AC individuals.
