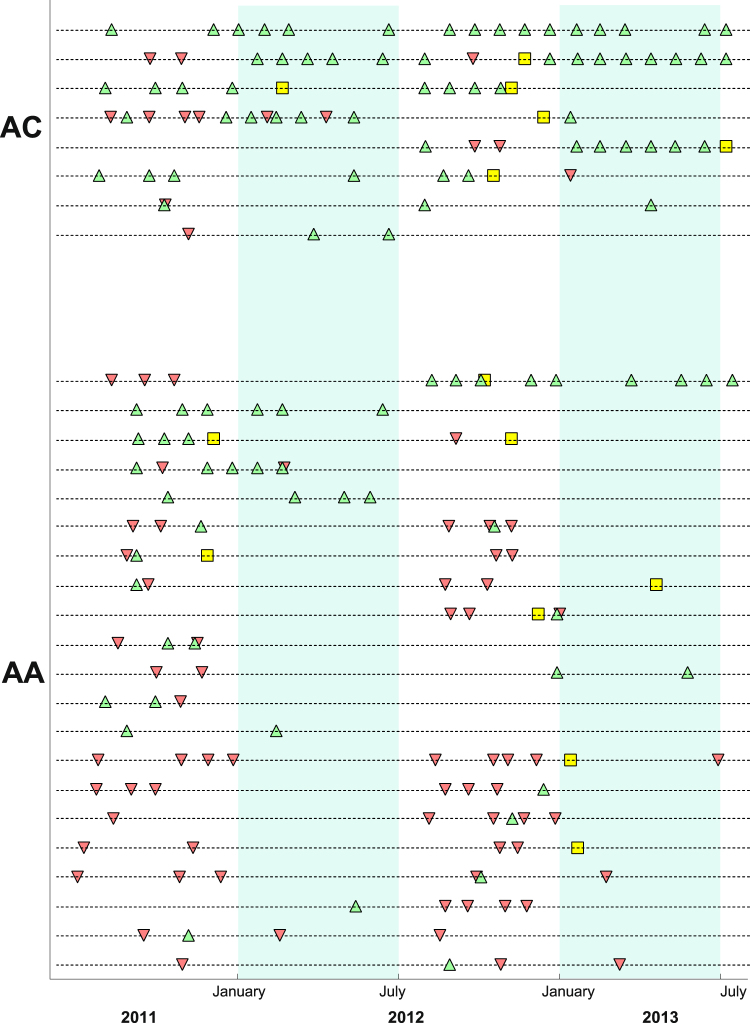
Figure 3.
Long-term carriage of patent gametocytes and its temporal relationship with clinical malaria events in school-aged children. Scheduled visits with microscopically-detectable gametocytes are presented as green triangles; inverted red triangles correspond to clinical malaria episodes. Yellow squares represent clinical episodes with patent gametocytes on the day of diagnosis. Each dashed line corresponds to a study participant’s follow-up information. Only AA and AC children aged 5–15 years who carried patent gametocytes at least once during the study were included in this graph. Dry seasons are represented by light green areas. A version of this figure that also includes data from AS schoolchildren and data from children who only developed clinical malaria is presented in the Supplementary Information (Figure S3).

