Figure 5.
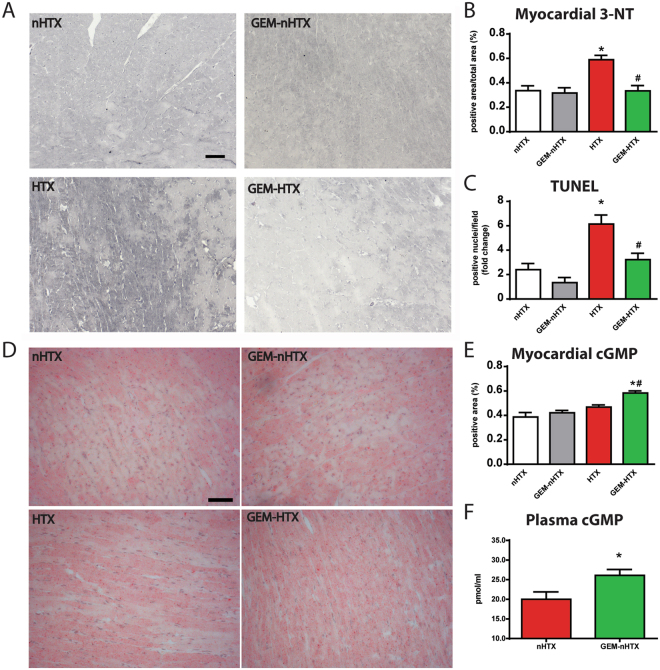
Histological analysis and plasma cGMP analysis. (A) Representative images of nitrotyrosine immunohistochemistry. Magnification: 200x, Marker: 50 µm (B) Quantification of nitrotyrosine immunohistochemistry. (C) Quantification of TUNEL-positive cardiomyocyte nuclei. (D) Representative images and quantification (E) of myocardial cGMP immunohistochemistry. Magnification: 200x, Marker: 50 µm (F) Quantification of plasma cGMP. Groups: control-group (nHTX), gemfibrozil-control group (GEM-nHTX), transplant-control group (HTX), gemfibrozil + transplant-group (GEM-HTX). *p < 0.05 vs. nHTX, #p < 0.05 vs. HTX.

