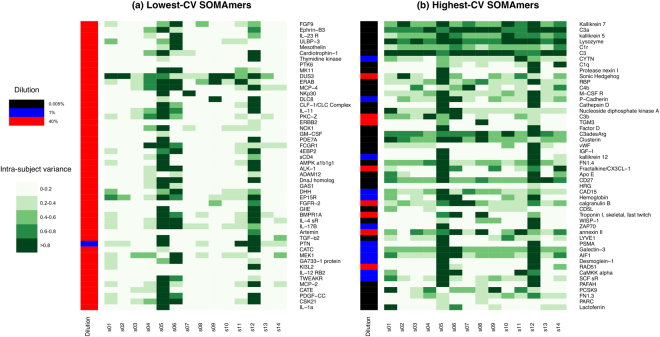
Figure 7.
Top-50 SOMAmers of (a) lowest and (b) highest technical CV were individually assessed for biological intra-subject baseline variability across a cohort of 14 healthy subjects. In different shades of green, the heatmaps display, for each SOMAmer (row), the ratio between the variance of the expanded data associated to one subject and the variance of all subjects combined. Sidebars to the left of each panel display the SOMAmers’ dilution groups.

