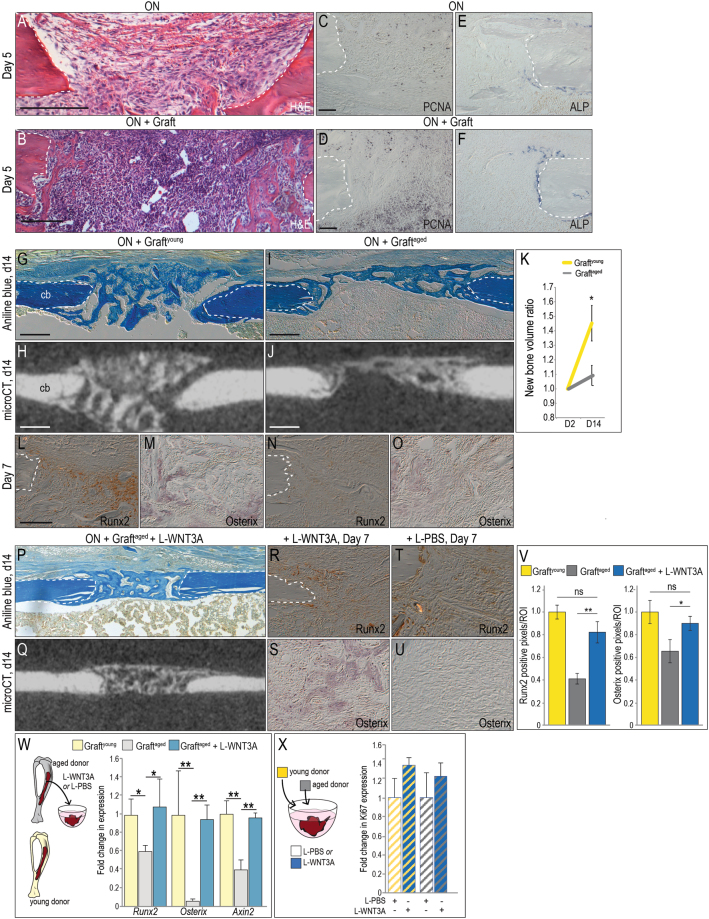
Figure 2.
L-WNT3A restores the osteogenic potential of age-compromised bone graft. (A) Representative H&E stained longitudinal tissue sections, focusing on the osteonecrotic lesion and (B) the osteonecrotic defect with an autograft, on post-surgery day 5. (C) On adjacent tissue sections, PCNA immunostaining identifies mitotically active cells in the osteonecrotic defect and (D) in defects treated with autografts. (E) ALP activity indicates the state of mineralization on day 5 in osteonecrotic defects and (F) in defects treated with autografts. (G) A representative longitudinal tissue section through an osteonecrotic defect treated with bone graft from a young syngeneic donor (e.g., graftyoung) and harvested on post-surgery day 14; stained with Aniline blue to illustrate bony bridging. (H) Micro-CT image from the same sample with the same orientation, illustrating radiodense tissue in the defect. (L) Near-adjacent tissue sections immunostained for Runx2 and (M) Osterix on post-surgery day 7. (I) Tissue sections through an osteonecrotic defect treated with bone graft from an aged syngeneic donor (e.g., graftaged) on post-surgery day 14; Aniline blue staining shows incomplete bridging of the defect, verified by (J) Micro-CT. (K) Quantification of regenerated mineralized tissue in the defect site expressed as a ratio compared to the initial (post-surgery day 2) time point. (N,O) Tissue section through osteonecrotic defect treated with graftaged and immunostained for (N) Runx2, and (O) Osterix on post-surgery day 7. (P) Aniline blue staining and (Q) Micro-CT imaging on post-surgery day 14 shows bony bridging of osteonecrotic defects that were transplanted with WNT-treated graftsaged. Runx2 and Osterix Immunohistochemical analyses of osteonecrotic defects treated with (R,S) graftaged + (T,U) L-WNT3A compared to L-PBS. (V) Quantification of immunostaining resulting from L-WNT3A compared to L-PBS treated grafts. (W) Schematic of experimental design, where graftaged was harvested from aged mice, treated with L-WNT3A (0.75 ng/µL) or L-PBS for 1 h then analyzed by qRT-PCR for relative expression of Axin2, Osterix, and Runx2. Expression levels of Axin2, Osterix, and Runx2 in the samples are illustrated as fold-change relative to baseline expression in graftyoung (yellow bars). (X) Schematic of experimental design where graftaged and graftyoung were treated with either L-PBS or L-WNT3A. Quantification of Ki67 expression is presented as fold-change relative to baseline in L-PBS-treated samples. Abbreviations: cb, cortical bone. Scale bars, 100 µm; same magnification was applied in panels C–F, in panels L–O,R-U and in panels G–J,P,Q. *p < 0.05.

