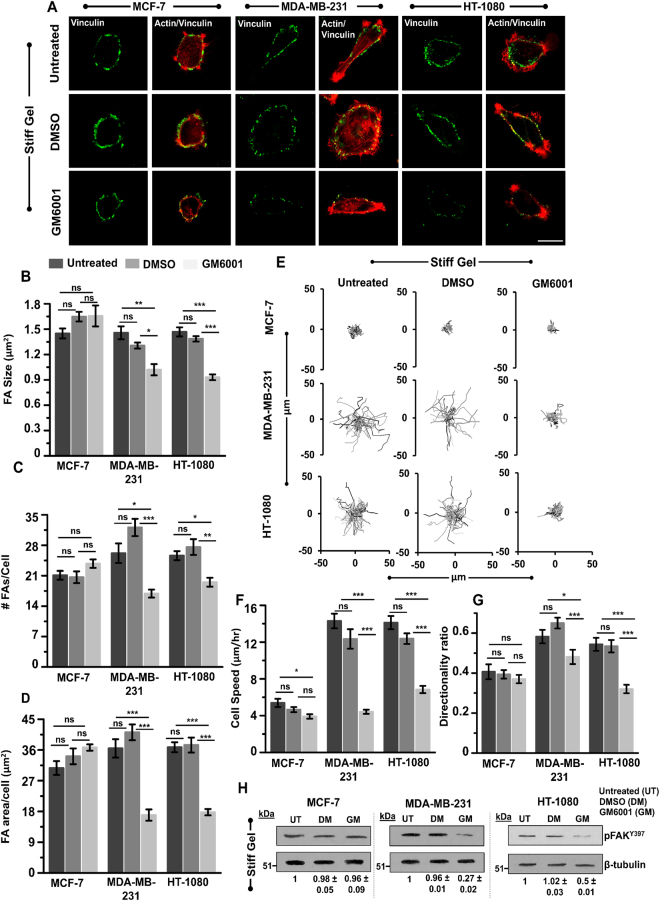
Figure 2.
Influence of MMP inhibition on focal adhesion and cell motility of MCF-7, MDA-MB-231 and HT-1080 cells. (A) Immunostained images of the focal adhesion protein vinculin (green) and F-actin (red) in untreated, DMSO treated and GM treated cells cultured on stiff PA gels. Scale bar = 20 μm. (B,C,D) Quantitative analysis of size, number of focal adhesion and focal adhesion area per cell in untreated, DMSO treated and GM treated cells (n = 2, at least 30–35 cells per condition; **p < 0.01, *p < 0.05, ns: not significant). Statistical significance was determined by one-way ANOVA/Fisher test. Error bars represent standard error of mean (±SEM). (E) Representative random cell migration trajectories of untreated, DMSO treated and GM treated cells cultured on stiff PA gels. (F,G) Quantitative analysis of cell speed (n = 2, 45–50 cells per condition; ***p < 0.001, ns: not significant) and directionality ratio (n = 2, 35–45 cells per condition; ***p < 0.001; *p < 0.05; ns: not significant) of untreated, DMSO treated and GM treated cells cultured on stiff PA gels. Statistical significance was determined by one-way ANOVA/Fisher test. Error bars represent standard error of mean (±SEM). (H) Western blot analysis of phosphorylated-focal adhesion kinase (pFAKY397) in untreated, DMSO treated and GM treated cells cultured on stiff PA gels. β-tubulin served as a loading control (n = 2).

