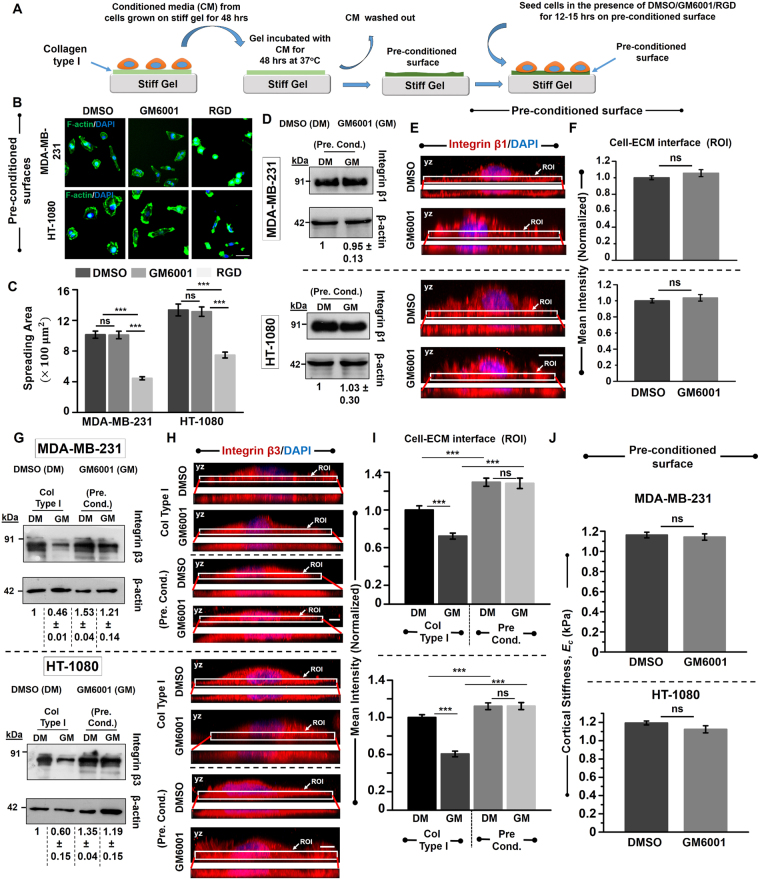
Figure 5.
Rescue of invasive phenotype of MDA-MB-231 and HT-1080 cancer cells on MMP pre-conditioned surfaces. (A) Schematic of generating pre-conditioned surfaces. Conditioned media (CM) was collected from MDA-MB-231 and HT-1080 cancer cells cultured for 48 hrs on Col I coated stiff gels. Fresh Col I coated stiff gels were then incubated with the collected CM for 48 hrs at 37 °C. Subsequently, the gels were washed and a fresh batch of MDA-MB-231 and HT-1080 cells were cultured in the presence of DMSO/GM/RGD for 12–15 hrs. (B) Representative fluorescent images of DMSO treated, GM treated and RGD treated cells on pre-conditioned surfaces (Scale bar = 50 µm). Cells were stained for F-actin (green) and DAPI (blue) respectively. (C) Quantitative analysis of spreading of DMSO treated, GM treated cells and RGD treated cells (along with RGD peptide, equivalent amount of DMSO was also added) on MMP-pre-conditioned surfaces (n = 2, 150–170 cells per condition; ***p < 0.001, ns: not significant). Statistical significance was determined by Kruskal-Wallis ANOVA/Mann-Whitney test. Error bars represent standard error of mean (±SEM). (D) Western blot analysis of integrin β1 in DMSO treated and GM treated cells cultured on pre-conditioned surfaces. β-actin served as loading control (n = 2). (E) Representative maximum intensity projection of DMSO treated and GM treated cells (along the height of the cells (YZ plane)) cultured on pre-conditioned surfaces and stained for integrin β1 (red) and DNA binding dye DAPI (blue) (Scale bar = 10 µm). Insets show localization of integrin β1 at the basal cell-ECM interface (ROI, region of interest). (F) Quantification of mean integrin β1 intensity at the basal surface in DMSO treated and GM treated cells (normalized with respect to mean intensity of DMSO treated cells) (n = 2, 30 cells per condition; ns: not significant). Statistical significance was determined by one-way ANOVA/Fisher test. Error bars represent standard error of mean (±SEM). (G) Western blot analysis of integrin β3 in DMSO treated and GM treated cells cultured on Col I/pre-conditioned surfaces. β-actin served as loading control (n = 2). (H) Representative maximum intensity projection of DMSO treated and GM treated cells cultured on Col I/pre-conditioned surfaces and stained for integrin β3 (red) and DNA binding dye DAPI (blue) (Scale bar = 5 µm). Insets show localization of integrin β3 at the basal cell-ECM interface (ROI, region of interest). (I) Quantification of mean integrin β3 intensity at the basal surface in DMSO treated and GM treated cells (normalized with respect to mean intensity of DMSO treated cells cultured on Col I coated gels) (n = 2, 25–30 cells per condition; ***p < 0.001; ns: not significant). Statistical significance was determined by two-way ANOVA. Error bars represent standard error of mean (±SEM). (J) Quantitative analysis of cell cortical stiffness of DMSO treated and GM treated cells on pre-conditioned substrates (n = 2, 110–130 cells per condition; ns: not significant). Statistical significance was determined by Mann-Whitney test. Error bars represent standard error of mean (±SEM).

