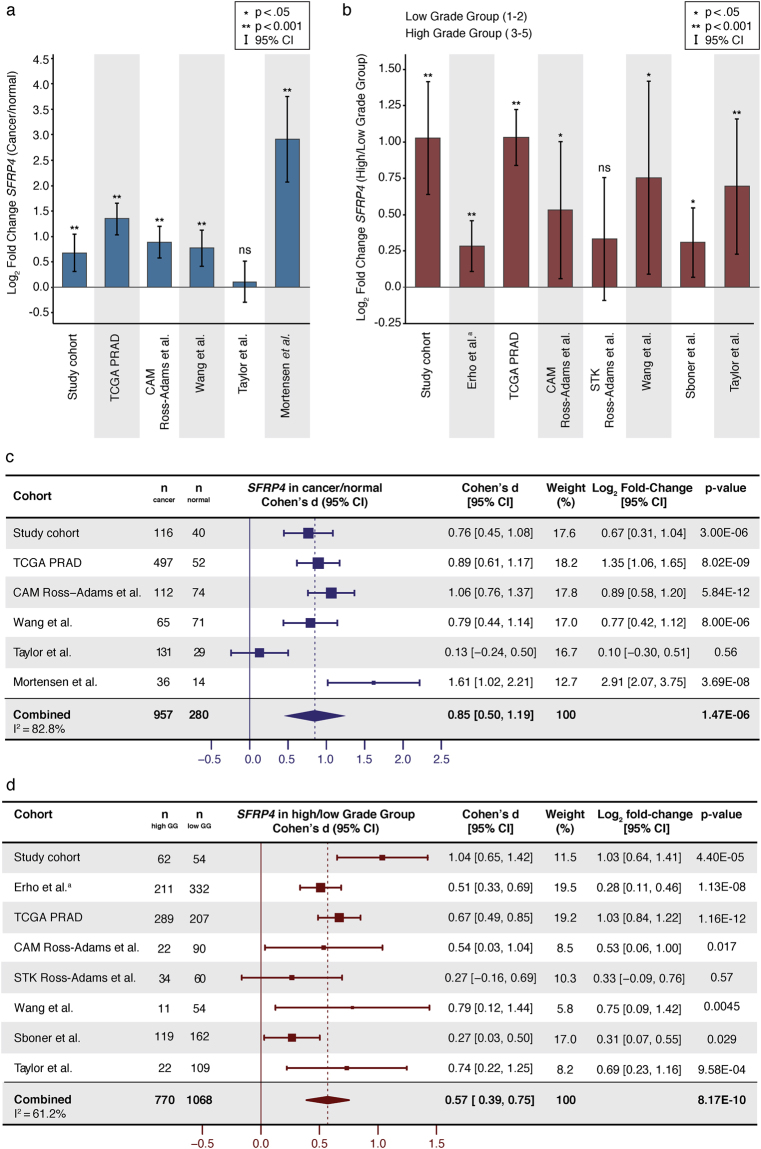
Figure 1.
SFRP4 gene expression in prostate cancer. (a) Log2 fold change of SFRP4 expression in cancer compared with normal samples (b) Log2 fold change of SFRP4 expression in high Grade Group (3–5) compared with low Grade Group (1–2) samples. (c) Forest plot and meta-analysis of SFRP4 expression in prostate cancer compared with normal prostate samples. (d) Forest plot and meta-analysis of SFRP4 expression in high Grade Group compared with low Grade Group prostate cancer samples. Abbreviations: ns - not significant, GG – Grade Group, CI – confidence interval. aIn the Erho et al. cohort, low Grade Group included GG 1–3, and high Grade Group included GG 4–5.

