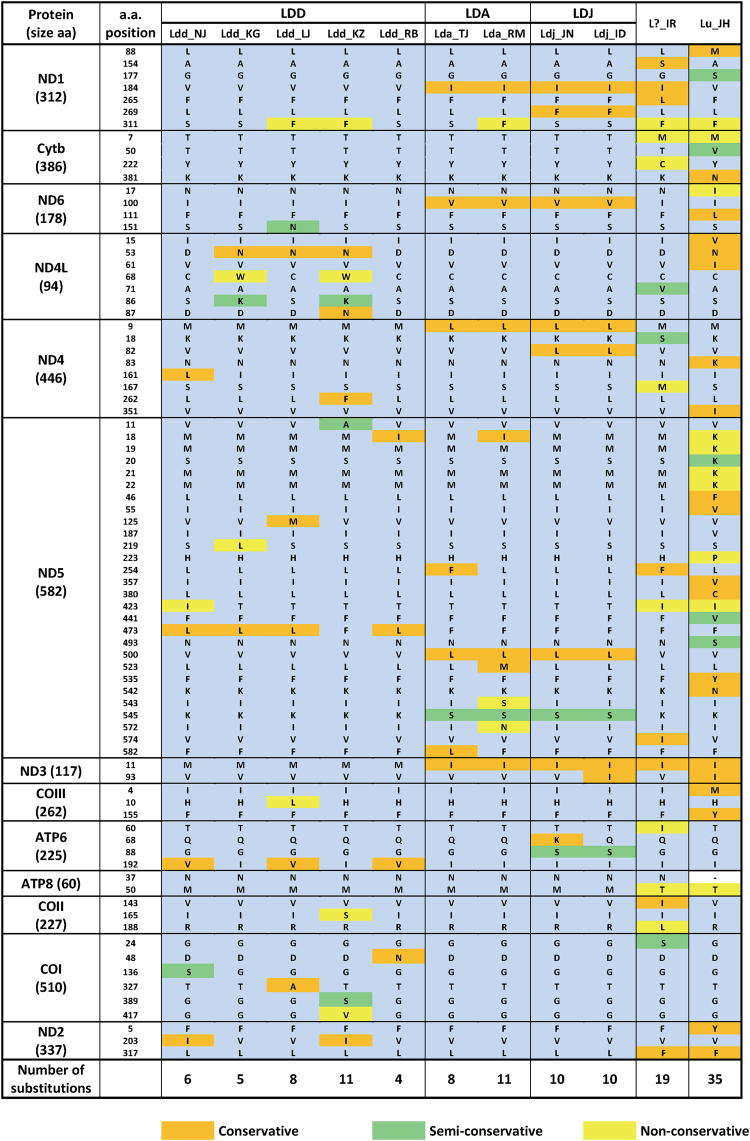
Figure 4.
Comparative analysis of amino acid substitutions among the 13 PCGs of the 11 mitochondrial genomes sequenced in the present study. Unsubstituted amino acids at a given position are shaded in blue; substitutions are shaded in different colors according to their conservativeness (see legend). To identify substitutions and assess their level of conservativeness, amino acid sequences were aligned in MAFFT, using the ClustalW output format.

