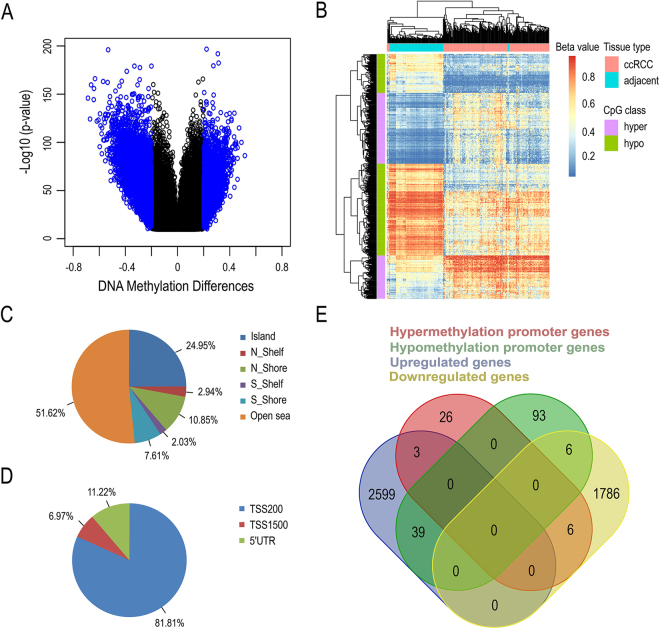
Figure 1.
Differential methylation between ccRCC and adjacent tissue. (A) Volcano plot showing the distribution of CpG sites from the site-level test assessed by methylation differences and adjusted P values. All of CpGs are with FDR < 1E-10, CpGs in blue are differentially methylated more than 0.2 or less than −0.2; (B) Heatmap of differentially methylated CpGs within promoters between ccRCCs and adjacent tissues. Hierarchical clustering by 265 ccRCCs (pink color bar) and 133 adjacent tissues (blue-green color bar) with 986 significant CpGs within promoters (FDR < 1E-10, |Delta Beta| > 0.2); Red/blue gradient represents beta values of the methylation sites; (C) Promoter region distribution of promoter differential methylated CpG sites; (D) CpG island distribution of promoter differential methylated CpG sites; (E) Venn diagram showing the overlaps of the genes with the differential promoter methylation and mRNA regulation.

