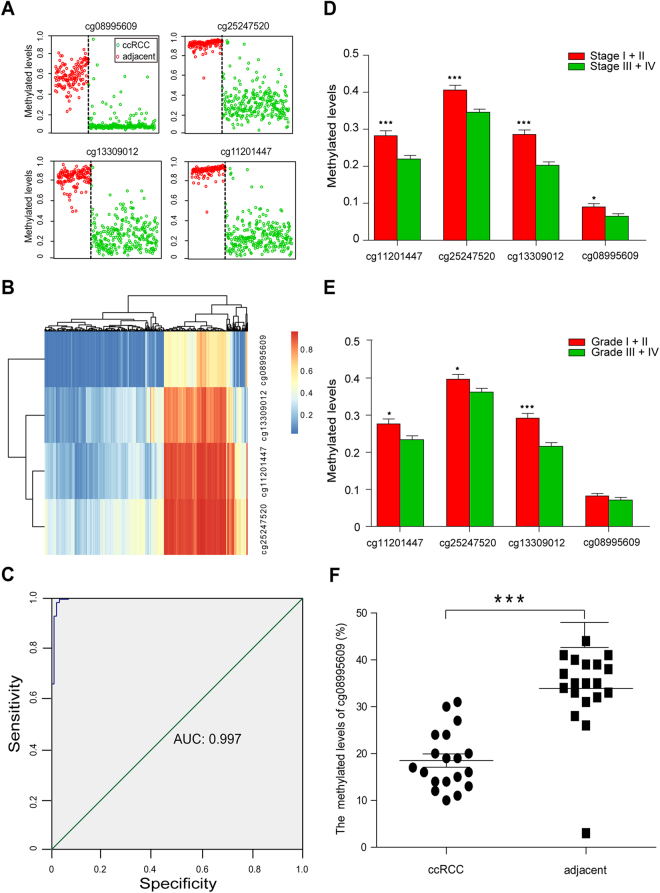
Figure 2.
The methylated levels of cg11201447, cg25247520, cg13309012, cg08995609. (A) Methylated levels of the 4 CpGs in 265 ccRCCs (green circle) and 133 adjacent normal tissues (red circle) from the TCGA; (B) Heat map showing methylations of the 4 CpGs in 265 ccRCCs and 133 adjacent normal tissues. Red/blue gradient represents beta values of the methylation sites; (C) The ROC curve for the 4 CpGs combination that differentiates between 265 ccRCCs and 133 adjacent normal tissues; (D) The difference methylated levels of the 4 CpGs in ccRCC patients with stage I+II and stage III+IV; (E) The difference methylated levels of the 4 CpGs in ccRCC patients with tumor grade stage I+II and stage III+IV; (F) The percent levels of cg08995609 methylation in 19 ccRCCs and matched adjacent tissues.

