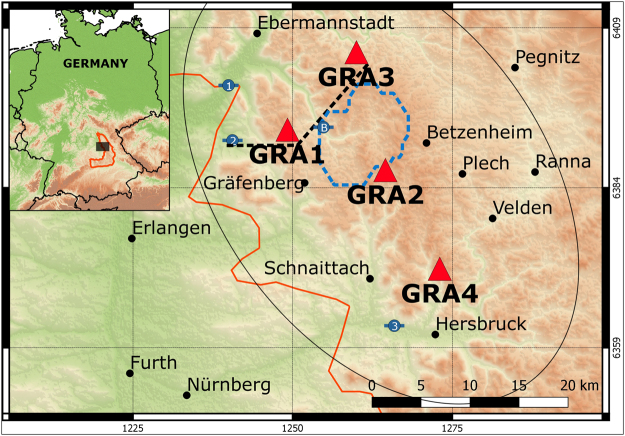
Figure 1.
Geographical location of the study area. The GRA stations used in this study are shown as red triangles. The background topography, based on SRTM (Shuttle Radar Topography Mission63), is colored and shaded. The altitude ranges from 200 m to 800 m (green to brown). The piezo metric stations (1 to 3) and the Bärenthal discharge station (B) are shown as blue symbols, while the dashed blue line outlines the modeled watershed. The contour of the Franconian Jura32 is outlined in orange. The black dashed line shows the location of the cross-section of Fig. 2. The thin black contour shows the approximate area of maximum sensitivity of the dv/v measurements. The cities, coastlines and country borders are obtained from “Natural Earth data”. This map has been plotted in QGIS61.

