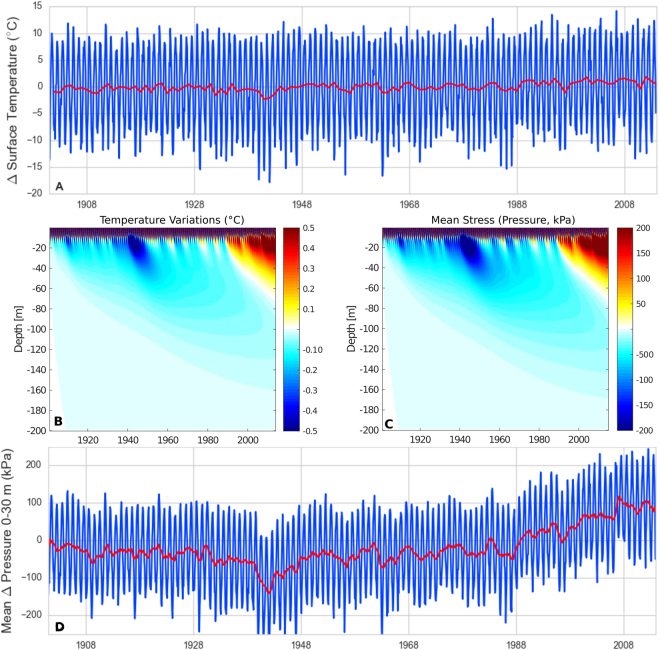
Figure 12.
Thermoelastic stress processing scheme: (A) observed monthly (blue) and annual (red) mean surface temperature variations; (B) modeled temperature diffusion and (C) associated thermoelastic pressure change as a function of depth and time. The colorscale of B is saturated to highlight deep temperature diffusion. (D) Modeled average pressure change (blue). The long-term variation (red) is calculated as 12-month running mean and is reported as the modeled relative thermoelastic pressure variation dpt.

