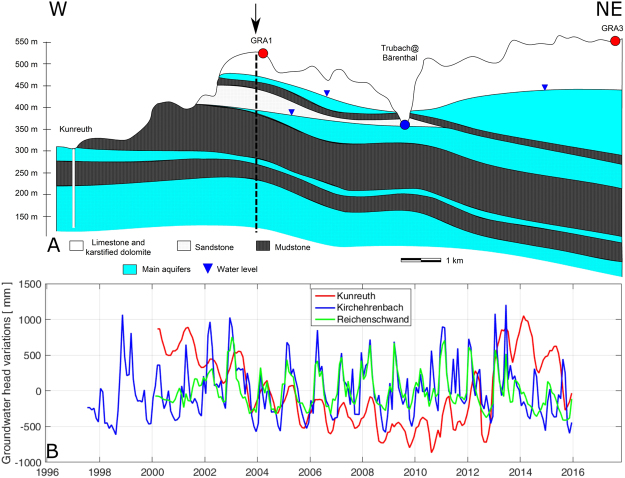
Figure 2.
(A) Hydrogeological W-E cross-section (adapted from Krüger 199432) illustrating the complexity of the aquifers under the Gräfenberg array (stations GRA1 and GRA3 are shown), locations of example piezometric levels (triangles) and the Bärenthal discharge station (circle) in the area. The arrow indicates where the profile changes orientation (see Fig. 1). (B) Groundwater head variations for the three piezometers in the area (http://www.gkd.bayern.de): Kunreuth (1 on the map in Fig. 1), Kirchehrenbach (2) and Reichenschwand (3).

