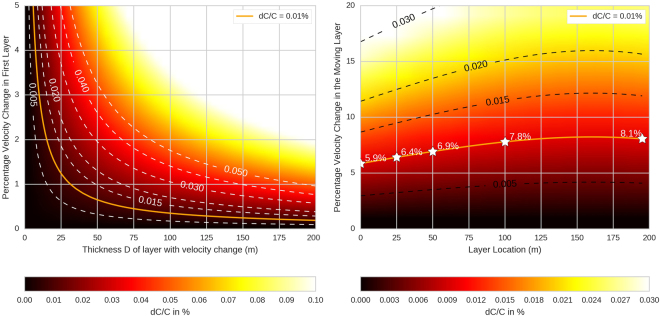
Figure 4.
Modeled change dC/C (colour code) created by a change in velocity (y-axis) in: Left: a layer extending from the surface down to a depth D (x axis) or Right: a 5 meter-thick layer located at different depths. The reference model is based on Krüger32. The white or black dashed lines show chosen dC/C isolines (in %) and the orange line indicates dC/C at + 0.01%. The white stars on the right plot indicate example values of required P-wave velocity changes to induce an observed + 0.01% dC/C.

