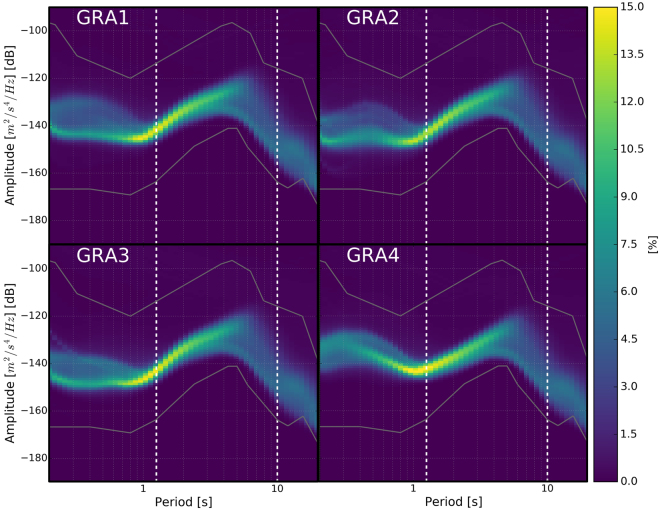
Figure 6.
Probabilistic power density spectrum (PPSD) of the vertical component (BHZ) records from the 4 stations used in this study. PPSDs are constructed from 1 hour individual PSDs, overlapping by 50%. The time span shown here includes all data available between 1977 and 2006, i.e. more than 500.000 individual Power Spectral Density (PSD). At each pixel (i.e. given period and amplitude), the color scale shows the percentage of spectra that fall into the pixel. The data acquired by the stations has been band-passed at acquisition time between 0.05 Hz and 5.0 Hz, so only this range is presented here. The frequency band used for the dv/v calculation is comprised between the white dashed lines, from between 1.25 s and 10 s. The New High or Low Noise Models43 are shown for reference.

