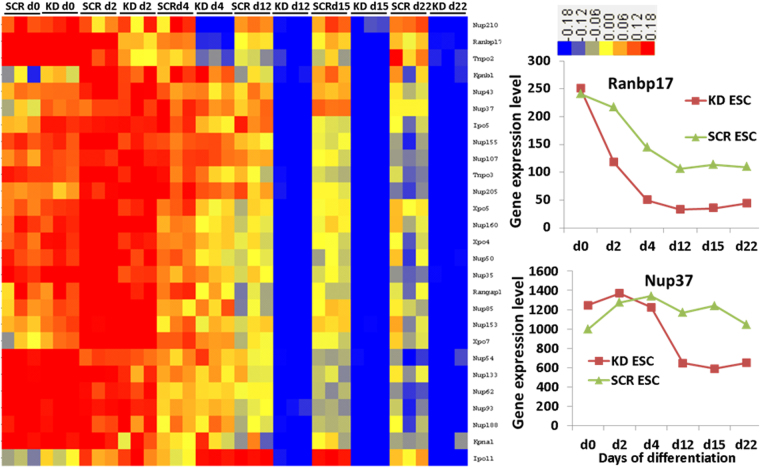
Figure 4.
Visualization of differentially expressed genes participating in nucleocytoplasmic trafficking. Replicates are displayed in the vertical axis and genes in the horizontal axis. Log2 transformed signal intensities are depicted in colour code. The heatmap indicates high expression levels in red, intermediate expression level in yellow and low expression levels in blue. Representative diagrams on the right show the gene expression of the Ranbp17 and Nup37.

