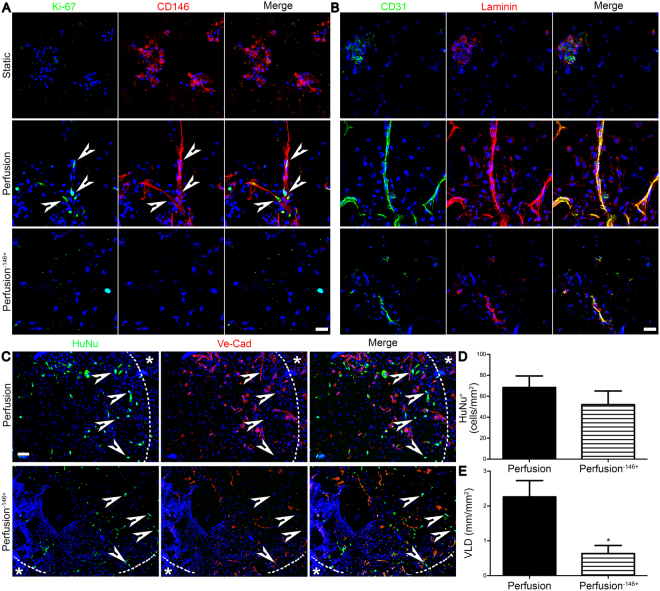
Figure 7.
Pericyte depletion decreased cell proliferation and in vitro pre- and in vivo early vascularization. Patches were analysed after 3 days in vivo. (A) Representative in vitro immunofluorescence images of proliferating cells (Ki-67; green) and pericytes (CD146; red). White arrows indicate proliferating CD146+ cells. Scale bar = 20 μm. (B) Representative in vitro immunofluorescence images for EC (CD31; green) and basal lamina (laminin; red). Scale bar = 20 μm. (C) Representative in vivo immunofluorescence for human cells (HuNu; green) and EC (Ve-Cad; red). Nuclei were stained with DAPI (blue in A–C). Dashed line outlines the border between the patch and the rat tissue (identified by the *). White arrows indicate human cells. Scale bar = 50 μm. (D) Quantification for the HuNu+ cells normalized over the analysed area. (E) VLD quantification normalized over the analysed area. *P < 0.05 (n donor = 3).

