
FIGURE 2.
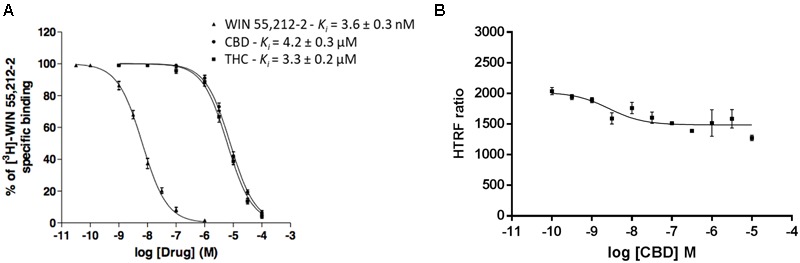
Competition curves in radioligand- and HTRF-based assays. (A) Competition curves of specific 3 nM [3H]-WIN 55,212-2 binding by unlabeled (0–10 μM) WIN 55,212-2, CBD and THC. (B) Competition curve of specific binding of 100 nM red CB2R ligand with increasing concentrations of CBD (0–10 μM) measured by HTRF. Data represent the mean ± SEM of a representative experiment (n = 4). HTRF ratio = (665 nm acceptor signal/620 nm donor signal) × 10,000.