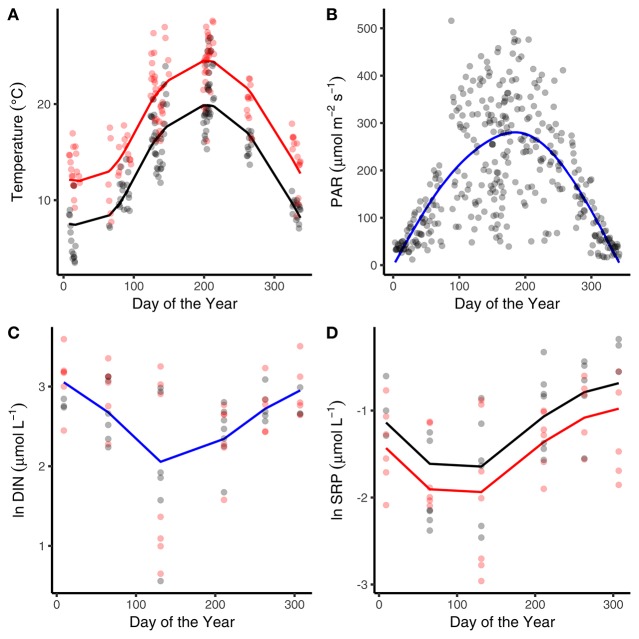
Figure 1.
Seasonal variation in abiotic variables. Seasonal changes and treatment effects on (A) average daily temperature, (B) average daily light intensity, (C) dissolved inorganic nitrogen, and (D) soluble reactive phosphorous (SRP). Black denotes ambient treatments, red indicates warmed treatments. Fitted lines are from the fixed effects of the best fitting mixed effects models. Where red and black fitted lines are present warmed and ambient treatments differed in either the median value and/or the seasonality of the response variable. Where the fitted line is blue a single function provided the best fit to the data from both treatments.

