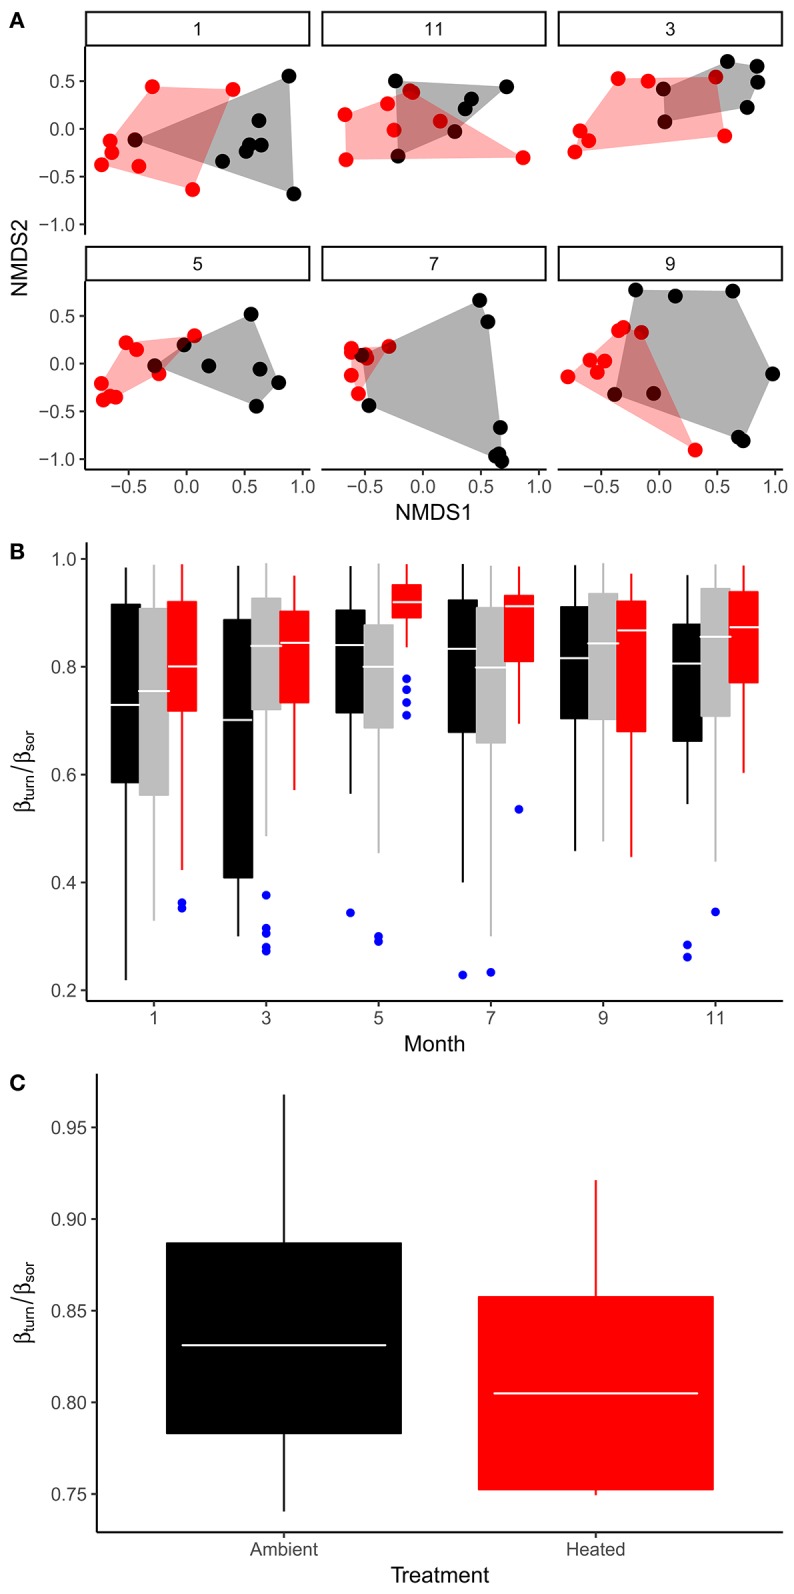
Figure 5.

Seasonal variation and treatment effects on phytoplankton community structure. (A) Non-metric multidimensional scaling (NMDS) of phytoplankton community composition comparing treatment effects across sampling months (1 = Jan, 3 = Mar, 5 = May, 7 = Jul, 9 = Sep, 11 = Nov). (B) Seasonal variation in the fraction of total beta-diversity among ponds that is attributable to taxonomic turnover (βturn/βsor), here black boxes encompass variation in βturn/βsor among ambient replicates, red show variation between warmed replicates and gray denotes variation in beta-diversity derived from comparisons among warmed vs. ambient replicates. (C) Treatment effects on βturn/βsor derived from temporal comparisons of community composition among sampling months within each mesocosm. Tops and bottoms of boxes in box-whisker plots correspond to the 25th and 75th percentiles, horizontal white lines correspond to medians, whisker extents correspond to 1.5 × the interquartile range.
