Figure 1.
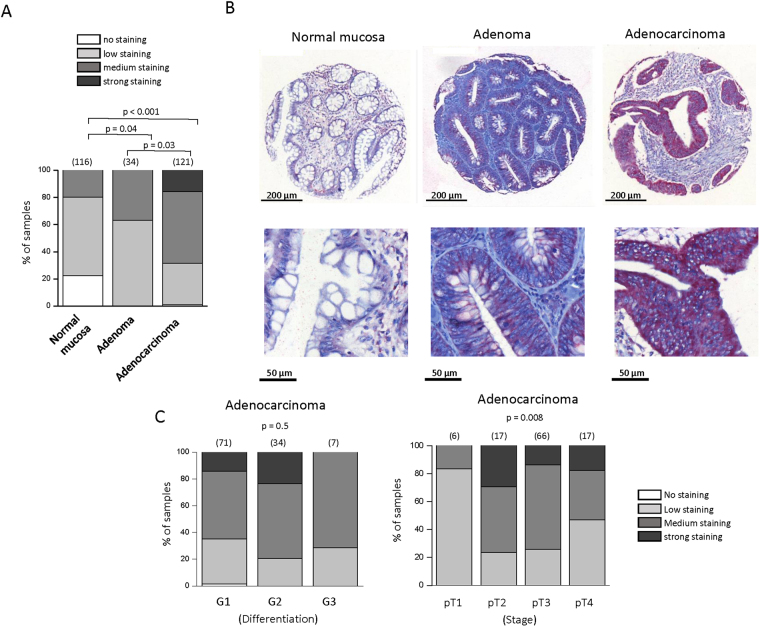
Immunohistochemical analysis of α1D protein expression in colon tissues microarrays. (A) Proportion of samples showing no (white), low (light gray), medium (black grey) or strong (black) α1D staining in normal mucosa, compared with adenoma and adenocarcinoma samples. The number of samples per condition is indicated in brackets. α1D staining was stronger in adenoma (χ 2, p < 0.04) and adenocarcinoma tissues (χ 2, p < 0.001) compared to normal tissues and in adenoma tissues compare to adenocarcinoma tissues (χ 2, p < 0.03). (B) α1D protein of CaV1.3 expression in normal mucosa (left), adenoma (center) and adenocarcinoma (right) from a same sample (1:100 dilution, Red revelation, Hematoxylin counter-coloration). Magnification, ×100 (top), ×300 (bottom). (C) Proportion of samples showing no (white), low (light gray), medium (black grey) or strong (black) α1D staining according to the state of differentiation (right) or stage (left) of adenocarcinoma samples. No difference was observed according the state of differentiation of adenocarcinoma samples (Kruskall Wallis test, p = 0.5). An influence of pT stages was observed on α1D staining (Kruskall Wallis test, p = 0.008).

