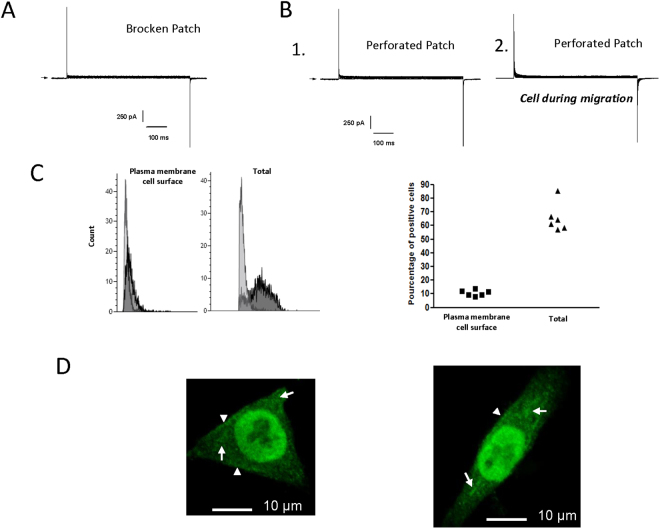
Figure 3.
Lack of detectable voltage-dependent Ca2+ currents and cellular localization of α1D protein. (A,B) Current records during 600 ms pulses in the range of −70 to 110 mV from holding potential of −100 mV. Representative examples of current recording in presence of barium (20 mM) and Bayk 8644 (50 µM) in broken (A) and perforated (B) patch configurations. Whole cell currents are obtained in normal condition (B.1) and during the migration process (B.2). Arrows indicates zero current. (C) Fluorescence-activated cell sorter (FACS) analysis of α1D protein in HCT116 cell line permeabilized or not. Control staining is shown in light grey, and dark grey represent staining with anti-CaV1.3. Graph represents the percentage of cells (N = 6) expressing α1D protein in permeabilized (Total) and not permeabilized cells (Plasma membrane cell surface). (D) Subcellular distribution of α1D protein in HCT116 cell line. A primary anti-CaV1.3 antibody was used with a secondary AlexaFluor 488-conjugated anti-rabbit (green color). The short arrows indicate the location α1D protein in the edges membranes, and the long arrows show the presence of α1D protein in the cytosol.

