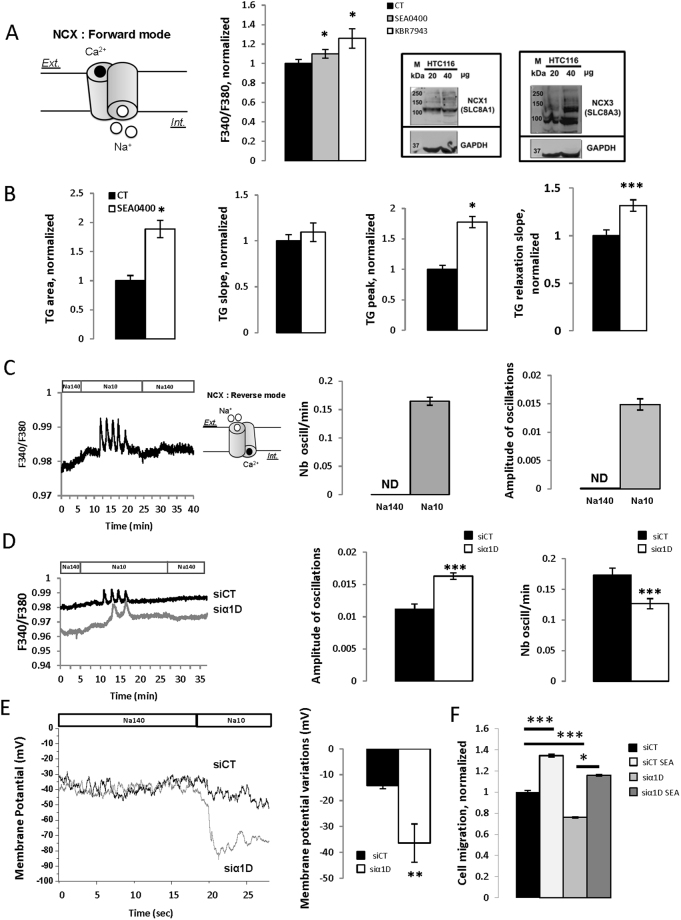
Figure 5.
α1D protein regulated cytosolic Ca2+ concentration by inhibiting NCX. (A) left, the schema represents NCX working in its forward mode driving Na+ entry and Ca2+ efflux. Middle, Histograms showing the effect of 10 µM SEA0400 or 30 µM KBR7943 on F340/F380 ratios. Results are normalized to CT conditions and are expressed as mean ± S.E.M. *Significantly different from control (p = 0.05, N = 3, n = 12, Kruskal-Wallis one way analysis of variance. Right, Representative cropped Western blot of NCX1 and NCX3 in HCT116 colon cancer cells (N = 3). Full-length Western blots are included in the Supplementary Fig. 6. (B) Histograms showing the effect of 10 µM SEA0400 on TG slope, the TG area, the TG peak Ca2+ responses and the TG relaxation slope. Results are normalized to CT conditions and are expressed as mean ± S.E.M. *Significantly different from control (p = 0.001, N = 3, n = 12, Mann Whitney test). (C) Time dependent measurements of [Ca2+]c in the presence of 140 mM (Na140) or 10 mM (Na10) of external Na+ concentration. The schema represents NCX working in its reverse mode driving Na+ efflux and Ca2+ entry. Histograms showing the effect of reducing external Na+ concentration to 10 mM on the amplitude and on the frequency of Ca2+ responses. Results are expressed as mean ± S.E.M. (D) Time dependent measurements of [Ca2+]c in the presence of 140 mM or 10 mM of external Na+ concentration in control cells or in cells that have been silenced for significant differences between control and1D. Histograms showing the effect of silencing significant differences between control and1D (si significant differences between control and1D#1) on the amplitude and on the frequency of Ca2+ responses. Results are expressed as mean ± S.E.M. *Significantly different from control (amplitude: p = 0.001, N = 5, n = 77; N = 6, n = 94, Mann Whitney test and for frequency: p = 0.001, N = 5, n = 53; N = 6, n = 81, Mann Whitney test). (E), examples of membrane potentials recorded in one control HCT116 cell and in one HCT116 cell that have been silenced for α1D using the patch clamp technique in current clamp mode. Membrane potentials were recorded in Na140 or Na10 solutions. Histogram showing membrane potential variations between Na140 and Na10 conditions in control and significant differences between control and1D cells. Results are expressed as mean, bars, SEM. *Significantly different from control (p = 0.005, N = 3, n = 7 si-control; N = 3, n = 6 si significant differences between control and1D#1, Mann Whitney test). ND: not determined. F. Effect of silencing significant differences between control and1D in presence or not of 1 µM SEA0400 on migration of HCT116 cells (wound-healing cell migration assays). Results are normalized to si control conditions and results are expressed as mean ± S.E.M. *Significantly different from control (Si-Control with SEA0400; si significant differences between control and1D; si significant differences between control and1D with SEA0400, N = 4, n = 14).

