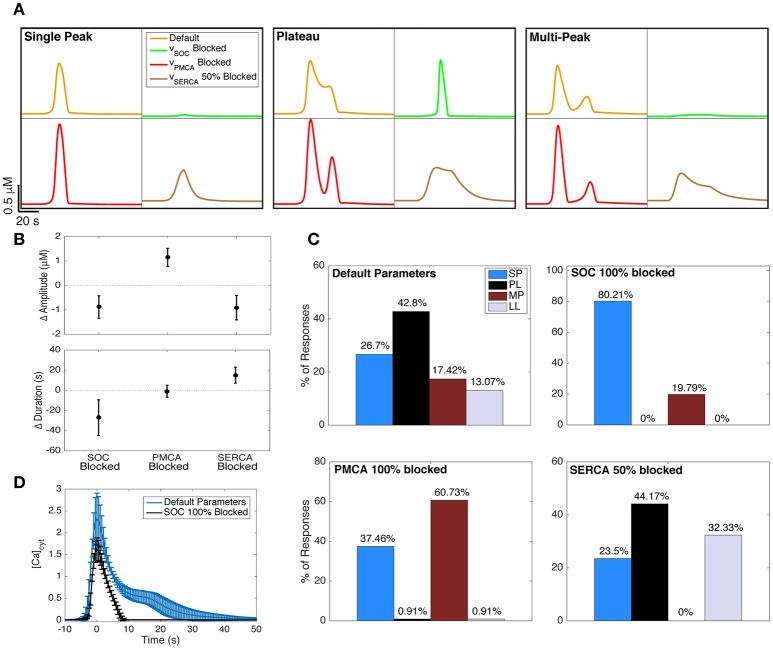
Figure 6.
Effect of blocking Ca2+ channels and pumps on Ca2+ responses. (A) The effects of blocking SOC channels (green traces), PMCA pumps (red traces), and SERCA pumps (brown traces) on example SP, PL, and MP responses generated with the default model parameters (yellow traces). The underlying IP3 dynamics for each panel are, from left to right (in order, A, drise, rrise, ddec): 0.2, 21, 0.002, 97 (SP), 0.375, 36, 0.002, 120 (PL), 0.2, 41, 0.15, 179 (MP). The IP3 input was applied 20 s after the start of the simulation. (B) The change in Ca2+ response amplitude and duration after blocking the three channels and pumps. For all 600 IP3 inputs, the mean change in response kinetics from the default Ca2+ response is shown, with its standard deviation. (C) The effects of blocking the channels and pumps on Ca2+ response type distributions. The upper left distribution (corresponding to default parameters) is repeated from the left panel of Figure 5A. (D) The average PL response with default model parameters (IP3 drise < 22 s, as in the right panel of Figure 5A) shown in blue. Using the same underlying IP3 dynamics as the input, we also generated the average Ca2+ response when SOC channels were fully blocked (black trace). As observed, the plateau phase of Ca2+ responses is eliminated when SOC channels are blocked in our model. To generate these average traces, the trace peaks were first aligned, ignoring latency. Error bars indicate standard deviations.

