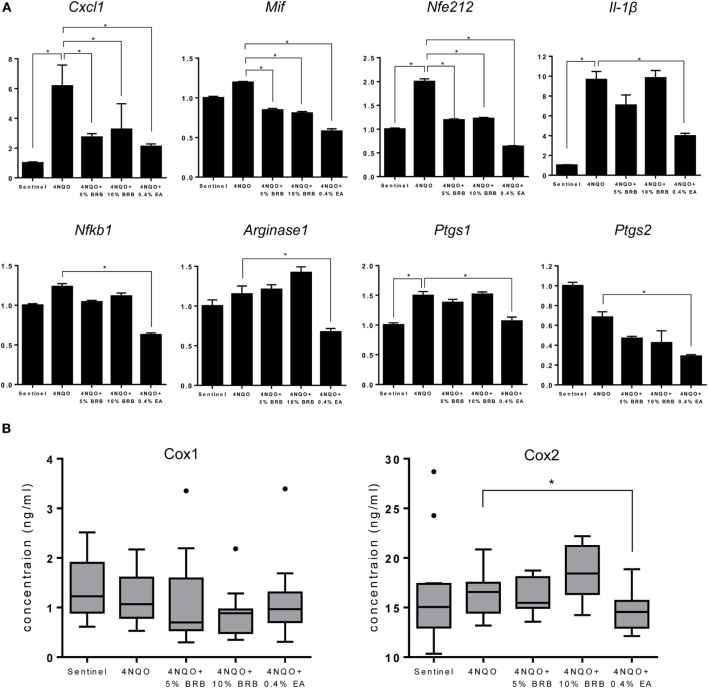
Figure 4.
(A) Gene expression profiles of the pro-inflammatory markers Cxcl1, Mif, Nfe212, Il-1β, Nfkb1, Arg1, Ptgs1, and Ptgs2 during 4-nitroquinoline 1-oxide (4NQO)-induced oral carcinogenesis determined by reverse transcription quantitative PCR. Data are presented as mean fold induction over sentinels ± SE. *p-value < 0.05 for each group (N ≥ 20) comparison using analysis of variance analysis. (B) Serum concentrations of cyclooxygenase 1 (Cox-1) and Cox-2 in randomly selected rats from each experimental group (N = 15) during 4NQO-induced oral carcinogenesis as determined by enzyme-linked immunosorbent assay. Data are presented as mean ± SE. *p-value < 0.05 for each respective group comparison using independent Student’s t-test.

