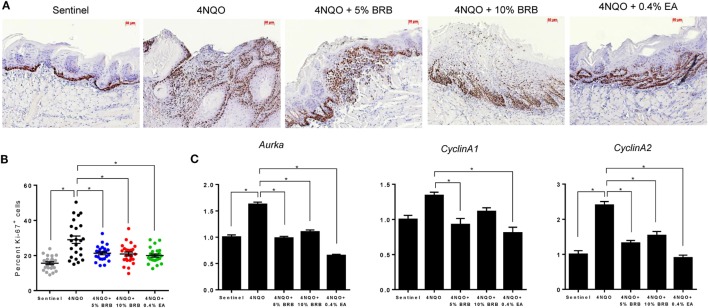
Figure 5.
(A) Representative microscopic images (×200) of tongue tissues from sentinel rats and 4-nitroquinoline 1-oxide (4NQO) exposed rats fed control diet, 5% black raspberry (BRB), 10% BRB, or 0.4% ellagic acid (EA). Paraffin sections were stained with anti-Ki-67 antibody and counterstained with hematoxylin. (B) Quantitation of Ki-67 positive cells in tongue epithelial tissue from sentinel rats as well as 4NQO exposed rats fed with control diet, 5% BRB, 10% BRB, or 0.4% EA. Graphic representation of percent Ki-67 positive nuclei relative to total nucleated cells in six random fields of tongue epithelium from selected rats from each experimental group. Data are expressed as percent cells ± SE. *p-value < 0.05 for each group comparison using independent Student’s t-test. (C) Gene expression profiles of the cell cycle associated biomarkers Aurka, Ccna1, and Ccna2 during 4NQO-induced oral carcinogenesis as determined by reverse transcription quantitative PCR. Data are presented as mean fold induction over sentinels ± SE. *p-value < 0.05 for each group (N ≥ 20) comparison using analysis of variance analysis.

