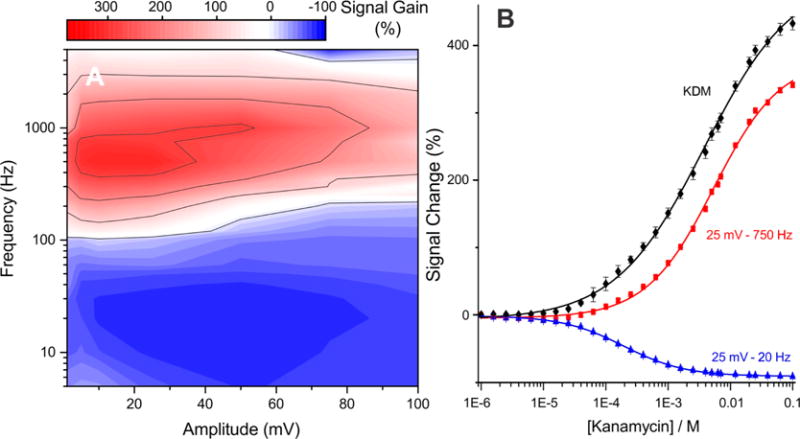
Figure 2.

Signal gain of E-DNA sensors is a strong function of both the frequency and the amplitude of the square-wave pulse. (A) Shown, for example, is a map of signal gain (relative change in current upon addition of “saturating” target) of an aminoglycoside-detecting sensor;29 depending on the amplitude/frequency pair the gain ranges from +315% (signal-on behavior) to −82% (signal-off behavior). (B) To more clearly illustrate these two behaviors, we show here the sensor’s response to its target when interrogated at an amplitude of 25 mV and frequencies of either 750 Hz (signal-on behavior; red curve) or 20 Hz (signal-off behavior; blue curve). Because the gains observed at these two frequencies differ in sign, taking their difference (kinetic differential measurements; KDM; black curve) leads to still greater gain.28 As expected, the signal change at 50 mM target using this amplitude frequency pair is in excellent agreement with the signal gain predicted by the map on the left.
